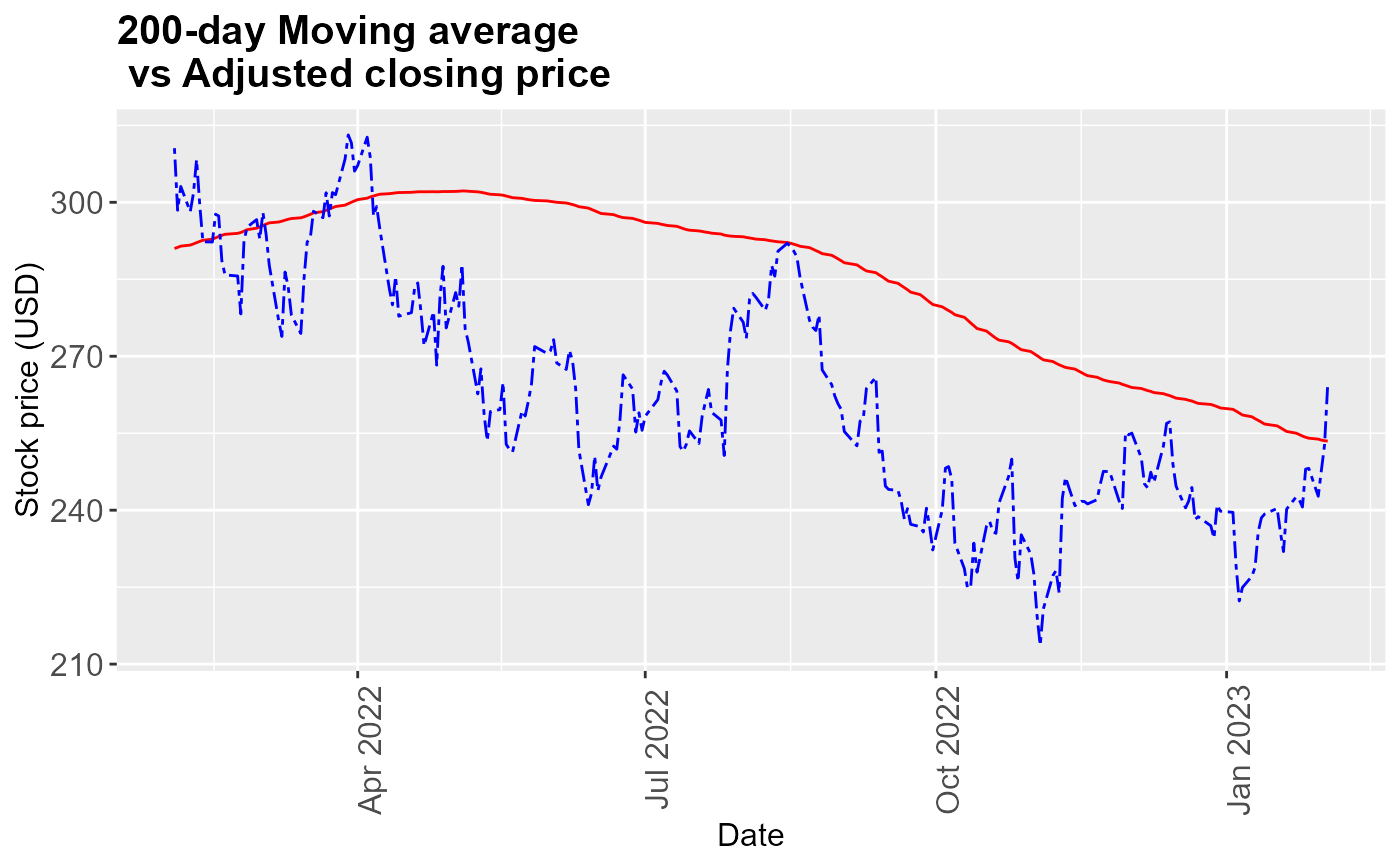
Plot stock price and corresponding 200 day moving average.
plot_200ma.RdPlot stock price and corresponding 200 day moving average.
Examples
plot_200ma("MSFT")
#> Rows: 9299 Columns: 8
#> ── Column specification ────────────────────────────────────────────────────────
#> Delimiter: ","
#> chr  (1): symbol
#> dbl  (6): open, high, low, close, volume, adjusted
#> date (1): date
#>
#> ℹ Use `spec()` to retrieve the full column specification for this data.
#> ℹ Specify the column types or set `show_col_types = FALSE` to quiet this message.