Predictive Analytics for Direct Marketing Campaign: A Banking Case Study#
by Gretel Tan, Yan Zeng, Charles Xu & Riya E. Shaju 2023/12/09
<jemalloc>: MADV_DONTNEED does not work (memset will be used instead)
<jemalloc>: (This is the expected behaviour if you are running under QEMU)
Summary#
In this project, we aimed to use customer information from a phone-call based direct marketing campaign of a Portugese banking institution to predict whether customers would subscribe to the product offered, a term deposit. We applied several classification based models (k-NN, SVM, logistic regression and random forest) to our dataset to find the model which best fit our data, eventually settling on the random forest model, which performed the best among all the models tested, with an F-beta score with beta = 5 of 0.82, and an accuracy of 0.675 on the test data.
While this was the best performing model out of the models tested, its accuracy still left much to be desired. This indicates that perhaps more data is needed to accurately predict whether customers would subscribe to the term deposit. Future studies may also consider using more features, a different set of features which might be more relevant to whether customers will subscribe, or utilising feature engineering to obtain features which might be more useful in helping to predict whether customers would subscribe to the service.
Introduction#
Direct marketing generally refers to the relational marketing process involving getting information on individual consumers, getting feedback on their responses to various measures like sales campaigns, and influencing their behaviours [Bauer and Miglautsch, 1992]. Many companies utilise direct marketing strategies to target individual groups of customers, reaching out specifically to groups of customers who will allow companies to meet their sales or business objectives [Moro et al., 2012], such as targeting advertising for a particular product to a specific group of customers who will be most likely to purchase that product. With the advent of rapidly advancing computer and database technologies, as well as the growing field of data science, companies and direct marketers now have unprecedented access to individual-level consumer information, which can be used to develop detailed customer profiles. These profiles are valuable to companies, providing them with great insight to guide the formulation of direct marketing campaigns, among other business strategies [Nowak and Phelps, 1995]. As such, companies are keen to utilise technology to revolutionise marketing, using the information and metrics available to them to maximise the value they can get from each consumer over their lifetimes [Moro et al., 2012].
Our project aims to predict whether individual customers will subscribe to a service provided by a company, based on demographic information collected about each customer. Should the model be good enough to predict whether customers are likely to subscribe to the service accurately, the company, a Portugese banking institution, would be able to target ads and marketing phone calls only at the new customers who are most likely to subscribe to this service, or similar services. This would result in huge savings in terms of company resources, freeing up campaign funds and human resources, which might have otherwise been wasted on calling reluctant customers, to be redirected to other services which might benefit the company more. It might also reduce annoyance in customers, as, ideally customers will only receive calls if they are likely to be interested in a product, and would not have to entertain calls or ads about products which they do not care about. This presents a win-win situation for both consumers and the company.
Methods#
Data#
In this project, a dataset about direct marketing campaigns of a Portugese banking institution, from Sérgio Moro, P. Rita, and P. Cortez was used [Moro et al., 2012]. The data was downloaded from UC Irvine’s Machine Learning Repository, and the link can be found here. The dataset has 16 features and 45211 instances, with each row representing information about a single client of the Portugese bank. The aim of the authors in creating the data set was to predict whether the client will subscribe a term deposit, which is captured by the ‘subscribed’ column. We have also used this column as our target in our analysis.
The columns in our dataset are as follows:
Variable Name |
Role |
Type |
Demographic |
Description |
Units |
Missing Values |
|---|---|---|---|---|---|---|
age |
Feature |
Integer |
Age |
no |
||
job |
Feature |
Categorical |
Occupation |
type of job (categorical: ‘admin.’,’blue-collar’,’entrepreneur’,’housemaid’,’management’,’retired’,’self-employed’,’services’,’student’,’technician’,’unemployed’,’unknown’) |
no |
|
marital |
Feature |
Categorical |
Marital Status |
marital status (categorical: ‘divorced’,’married’,’single’,’unknown’; note: ‘divorced’ means divorced or widowed) |
no |
|
education |
Feature |
Categorical |
Education Level |
(categorical: ‘basic.4y’,’basic.6y’,’basic.9y’,’high.school’,’illiterate’,’professional.course’,’university.degree’,’unknown’) |
no |
|
default |
Feature |
Binary |
has credit in default? |
no |
||
balance |
Feature |
Integer |
average yearly balance |
euros |
no |
|
housing |
Feature |
Binary |
has housing loan? |
no |
||
loan |
Feature |
Binary |
has personal loan? |
no |
||
contact |
Feature |
Categorical |
contact communication type (categorical: ‘cellular’,’telephone’) |
yes |
||
day_of_week |
Feature |
Date |
last contact day of the week |
no |
||
month |
Feature |
Date |
last contact month of year (categorical: ‘jan’, ‘feb’, ‘mar’, …, ‘nov’, ‘dec’) |
no |
||
duration |
Feature |
Integer |
last contact duration, in seconds (numeric). Important note: this attribute highly affects the output target (e.g., if duration=0 then y=’no’). Yet, the duration is not known before a call is performed. Also, after the end of the call y is obviously known. Thus, this input should only be included for benchmark purposes and should be discarded if the intention is to have a realistic predictive model. |
no |
||
campaign |
Feature |
Integer |
number of contacts performed during this campaign and for this client (numeric, includes last contact) |
no |
||
pdays |
Feature |
Integer |
number of days that passed by after the client was last contacted from a previous campaign (numeric; -1 means client was not previously contacted) |
yes |
||
previous |
Feature |
Integer |
number of contacts performed before this campaign and for this client |
no |
||
poutcome |
Feature |
Categorical |
outcome of the previous marketing campaign (categorical: ‘failure’,’nonexistent’,’success’) |
yes |
||
y |
Target |
Binary |
has the client subscribed a term deposit? |
no |
Analysis#
As our project is interested answering a classification problem, we decided to test different classification models to predict whether customers would subscribe to the term deposit.
Model Selection#
The models we chose to use are: the k-nearest neighbours (kNN), support vector machine (SVM), logistic regression, and random forest. We chose these models as they offer different benefits, and we were interested in finding out which model would work best for our data. We chose to include logistic regression as it offers both interpretability and potential to perform well in classification problems, while we chose the other models despite their lower interpretability as, in our case, it is not so critical that we understand why or how the model comes to its predictions as long as the model performs well.
Feature and Data Selection#
All variables from the original dataset except poutcome and contact were used to fit our models. 10% of the data was partitioned into the training set, and 90% of the data was partitioned into the test set, used for evaluating how well our best model would perform on unseen data.
Note: Because Docker containers have resource limits for CPU, memory, and I/O. In order to speed up the running of complex models (such as SVM, Random Forest), we decided to reduce the proportion of the training set to 10%. This is acceptable because our dataset is large enough that a 10% split still has 4500+ entries. Ideally, the code should execute within five minutes, depending on your computer configuration.
Metric Selection#
We used 5-fold cross-validation with the F-beta score (beta = 5) as the classification metric. Beta was chosen as 5 for the F-beta score as we would like to focus on making accurate predictions for the customers who might be interested in subscribing to the term deposit, corresponding to a higher recall. This is as because we would rather have false positives and annoy some customers who might not be interested in subscribing to our service, than miss out on customers who might want to subscribe to the service (false negatives), which would cause the bank to lose a potential opportunity. Furthermore, customers who fit this profile are more likely to subscribe to similar services, and if they are accurately identified, the bank will be able to target them more specifically in future campaigns.
Preprocessing#
Numeric variables were standardised immediately before model testing and fitting, while categorical variables were encoded via one-hot encoding. Numeric variables were standardised so that distance-based machine learning algorithms like kNN could be used, and also to improve the interpretability of the results and coefficients of regression models. One-hot encoding was used to encode categorical variables as there were a fixed number of categories for each variable, making the variables very amenable to one-hot encoding. This allowed us to capture the information in the variables in a simple and machine-readable way, without adding too many uninformative features which would complicate our models and make them computationally expensive to run.
The Python programming language [Van Rossum and Drake, 2009] was used to perform the analysis, with the following Python packages being used as well: [Harris et al., 2020], [McKinney, 2010], [VanderPlas, 2018], [Pedregosa et al., 2011], [Hunter, 2007]. The code used to perform the analysis and create this report can be found here: UBC-MDS/Group_7_Project.
Results & Discussion#
We started our analysis by reading in the data from the repository. After doing exploratory data analysis of our data, we decided to drop the ‘poutcome’ and ‘contact’ features from our data, as there were many NaN values in the two feature columns for them, limiting the usefulness of these features in our model training and predictions. Plotting histograms of the features (Figure 1), coloured by class (whether the customer subscribed or not) revealed that the features were sufficiently differently distributed for us to be confident that we should include all other features in training our models. We also identified that there was great class imbalance in our target (Figure 2). As such, we decided not to use accuracy as the metric used to evaluate our model, as it would not give us a good idea of whether the model is performing well or not, preferring to use the F-beta score (beta = 5) instead.
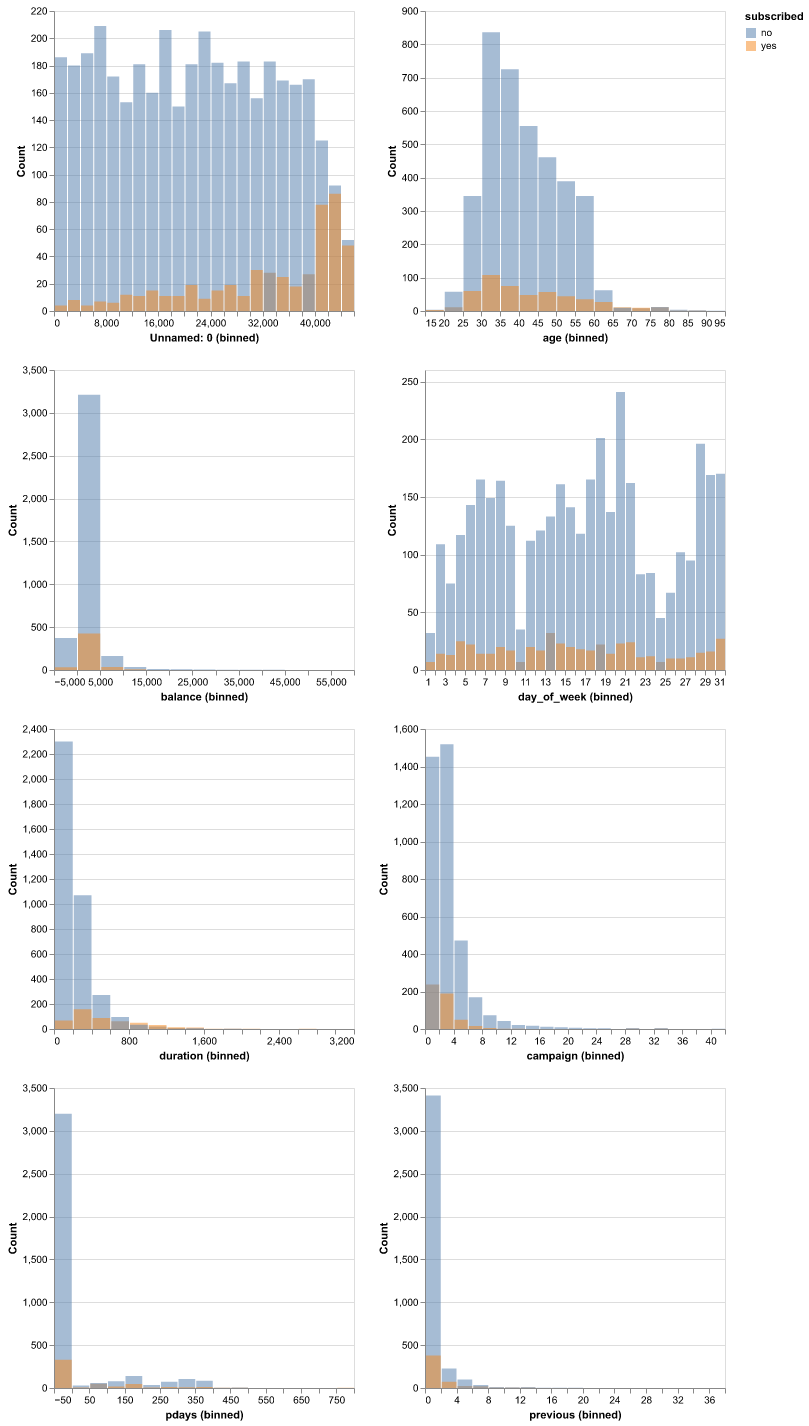
Fig. 1 Comparison of the empirical distributions of training data numerical columns.#
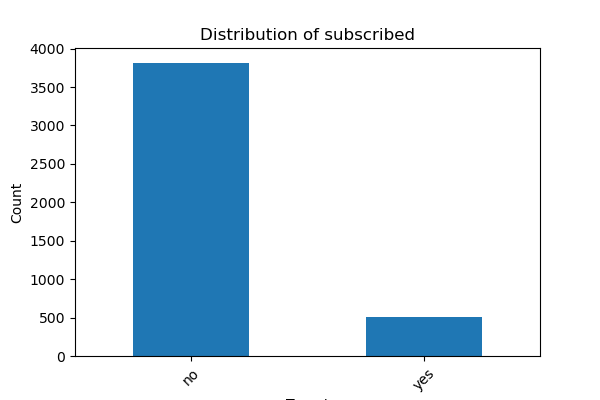
Fig. 2 Comparison of the empirical distributions of target values.#
We did hyperparameter optimisation for the following classification models: k-nearest neighbours classifier (Figure 3), support vector machine (Figure 4), logistic regression (Figure 5), and random forest model (Figure 6). To find the best model, we performed 5-fold cross validation within GridSearch using F-beta score (beta = 5) as our metric of model prediction performance.
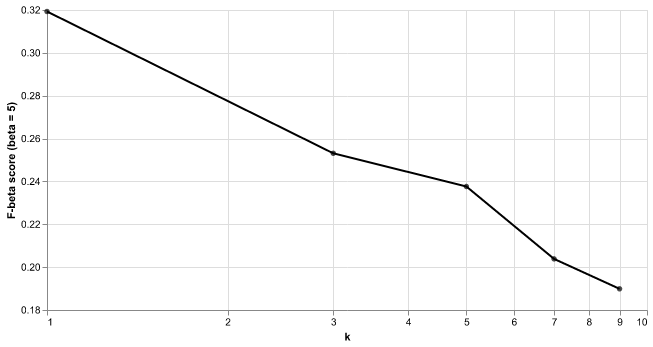
Fig. 3 Results from 5-fold cross validation of k-NN model to choose K. F-beta score (with beta = 5) was used as the classification metric as K was varied.#
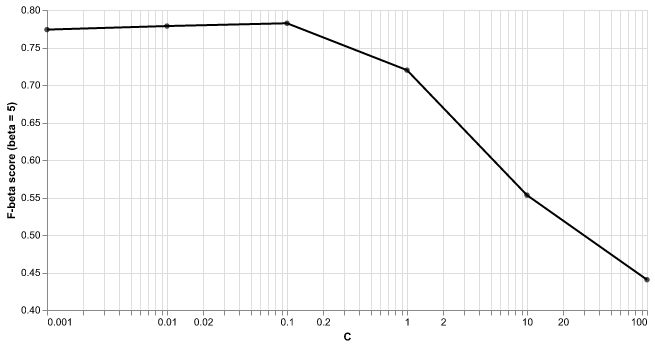
Fig. 4 Results from 5-fold cross validation of SVM model to choose C. F-beta score (with beta = 5) was used as the classification metric as C was varied.#
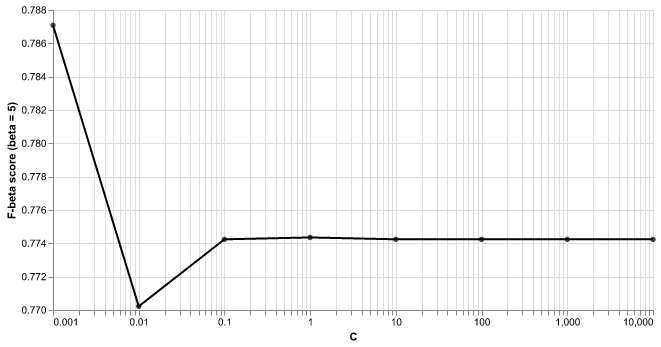
Fig. 5 Results from 5-fold cross validation of logistic regression model to choose C. F-beta score (with beta = 5) was used as the classification metric as C was varied.#
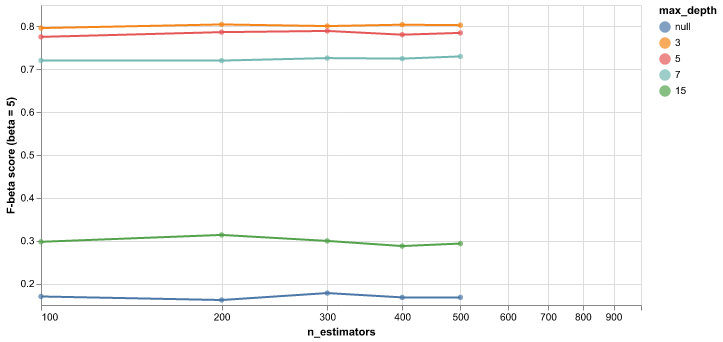
Fig. 6 Results from 5-fold cross validation of random forest model to choose max_features and max_depth. F-beta score (with beta = 5) was used as the classification metric as max_features and max_depth were varied.#
Out of the above models, the random forest model performed the best, with its best, hyperparameter-optimised model having a mean test score of 0.826, which was the highest mean test score for the optimised models. We thus decided to use the random forest model for our final predictions with the test data.
| model_name | mean_train_score | mean_test_score |
|---|---|---|
| K-Nearest Neighbors | 0.508000 | 0.239000 |
| SVC RBF | 0.810000 | 0.790000 |
| Logistic Regression | 0.799000 | 0.784000 |
| Random Forest | 0.843000 | 0.826000 |
Fig. 7 Performance comparison across all models.#
The random forest model performed similarly on the test data when compared to the training data, having an F-beta score (beta = 5) of 0.82 on the test data. This was only slightly lower than the mean test score of the best model after cross validation using the training data, which was 0.826. This relatively high F-beta score and the small gap between the scores indicates that the model is quite good at predicting whether customers will subscribe to the term deposit, and is likely to generalise well to unseen data. It had quite a low accuracy, with 12184 false positives and 4075 actual positives. This is expected as we heavily favoured recall, and acceptable as the high number of false positives is not of large consequence to the bank.
| accuracy | F-beta score (beta = 5) |
|---|---|
| 0.675000 | 0.820000 |
Fig. 8 Accuracy and F-beta score of model performance on test data.#
| Predicted: no | yes | |
|---|---|---|
| Actual label: | ||
| no | 22171 | 12184 |
| yes | 444 | 4075 |
Fig. 9 Confusion matrix of model performance on test data.#
Conclusion#
Overall, given the context of our problem, we think the final random forest model can be used by the Portugese banking institution to predict customer responses to the digital marketing campaign. As the F-beta score (beta = 5) score of the model is quite high and the model does not seem to be overfit to the training data, it is probably safe to apply this model to new customers, and to predict whether they will be interested in subscribing to the term deposit. While the number of false positives might be higher than ideal, given the context of our problem, this poses limited risk to the institution and does not compromise the applicability of the model to the problem. This means that the bank can target ads and direct marketing calls about this term deposit, and potentially, other related products, to this specific group of customers, and can expect that the success rate would be quite high compared to a random group of customers.
While the high number of false positives is acceptable given the low-stakes nature of having false positives, it would still be beneficial to the bank to improve the performance of our model, and to reduce the number of false positives. In the future, the model may be refined by including more data points, which might help to train the model better. More relevant features may also be included to train the model better, and feature engineering may be carried out to further refine the model.
Limitations#
Small Training Set#
Due to computational constraints, we employed just 10% of our dataset in the training phase. This is as due to the small training size, our models might not have been as robustly trained as it could have been. While this was done due to computational constraints with the Docker container environment, in further analyses, it would be ideal if a container or virtual machine with more computational power could be used so that we can train the models on the full dataset instead. This would allow us to be more confident that the models were trained robustly and that it was not underfit to the real trends in the dataset.
Model Accuracy and Feature Engineering#
Our best model (Random Forest) tests with an accuracy of 0.675 which can be further improved. This accuracy of 0.675 is still not very high meaning that our model still cannot really explain a lot of variation in the data. We propose some solutions to improve model accuracy in future studies.
The prevailing issue of class imbalance results in a large number of false positives that undermine the reliability of our predictions. While, as explained above, this is acceptable within the scope of our project and research question, it would still be ideal to reduce the number of false positives while increasing the number of true predictions. To solve this in future analyses, we might need to use some more advanced preprocessing techniques or re-organize our data to handle the imbalance issue and refine the model’s precision. Furthermore, we could also add some feature engineering and feature selection; both leading to an enhanced performance of our model. Addressing this gap is crucial to uncover latent patterns and optimize the model’s learning capabilities.
References#
- BM92
C. L. Bauer and J. Miglautsch. A conceptual definition of direct marketing. Journal of Direct Marketing, 6(2):7–17, 1992. doi:10.1002/dir.4000060204.
- HMvdW+20
Charles R Harris, K Jarrod Millman, Stéfan J van der Walt, Ralf Gommers, Pauli Virtanen, David Cournapeau, Eric Wieser, Julian Taylor, Sebastian Berg, Nathaniel J Smith, Robert Kern, Matti Picus, Stephan Hoyer, Marten H van Kerkwijk, Matthew Brett, Allan Haldane, Jaime Fernández del Río, Mark Wiebe, Pearu Peterson, Pierre Gérard-Marchant, Kevin Sheppard, Tyler Reddy, Warren Weckesser, Hameer Abbasi, Christoph Gohlke, and Travis E Oliphant. Array programming with NumPy. Nature, 585(7825):357–362, 2020. URL: https://doi.org/10.1038/s41586-020-2649-2, doi:10.1038/s41586-020-2649-2.
- Hun07
J. D. Hunter. Matplotlib: a 2d graphics environment. Computing in Science & Engineering, 9(3):90–95, 2007.
- McK10
Wes McKinney. Data structures for statistical computing in python. In Stéfan van der Walt and Jarrod Millman, editors, Proceedings of the 9th Python in Science Conference, =51 – 56. 2010.
- MRC12(1,2,3)
S. Moro, P. Rita, and P. Cortez. Bank marketing. https://doi.org/10.24432/C5K306, 2012.
- NP95
G. J. Nowak and J. Phelps. Direct marketing and the use of individual-level consumer information: determining how and when “privacy” matters. Journal of Direct Marketing, 9(3):46–60, 1995. doi:10.1002/dir.4000090307.
- PVG+11
F. Pedregosa, G. Varoquaux, A. Gramfort, V. Michel, B. Thirion, O. Grisel, M. Blondel, P. Prettenhofer, R. Weiss, V. Dubourg, J. Vanderplas, A. Passos, D. Cournapeau, M. Brucher, M. Perrot, and E. Duchesnay. Scikit-learn: Machine Learning in Python. Journal of Machine Learning Research, 12:2825–2830, 2011.
- VRD09
Guido Van Rossum and Fred L. Drake. Python 3 Reference Manual. CreateSpace, Scotts Valley, CA, 2009. ISBN 1441412697.
- Van18
Jake VanderPlas. Altair: interactive statistical visualizations for python. Journal of open source software, 3(7825):1057, 2018. URL: https://doi.org/10.21105/joss.01057, doi:10.21105/joss.01057.