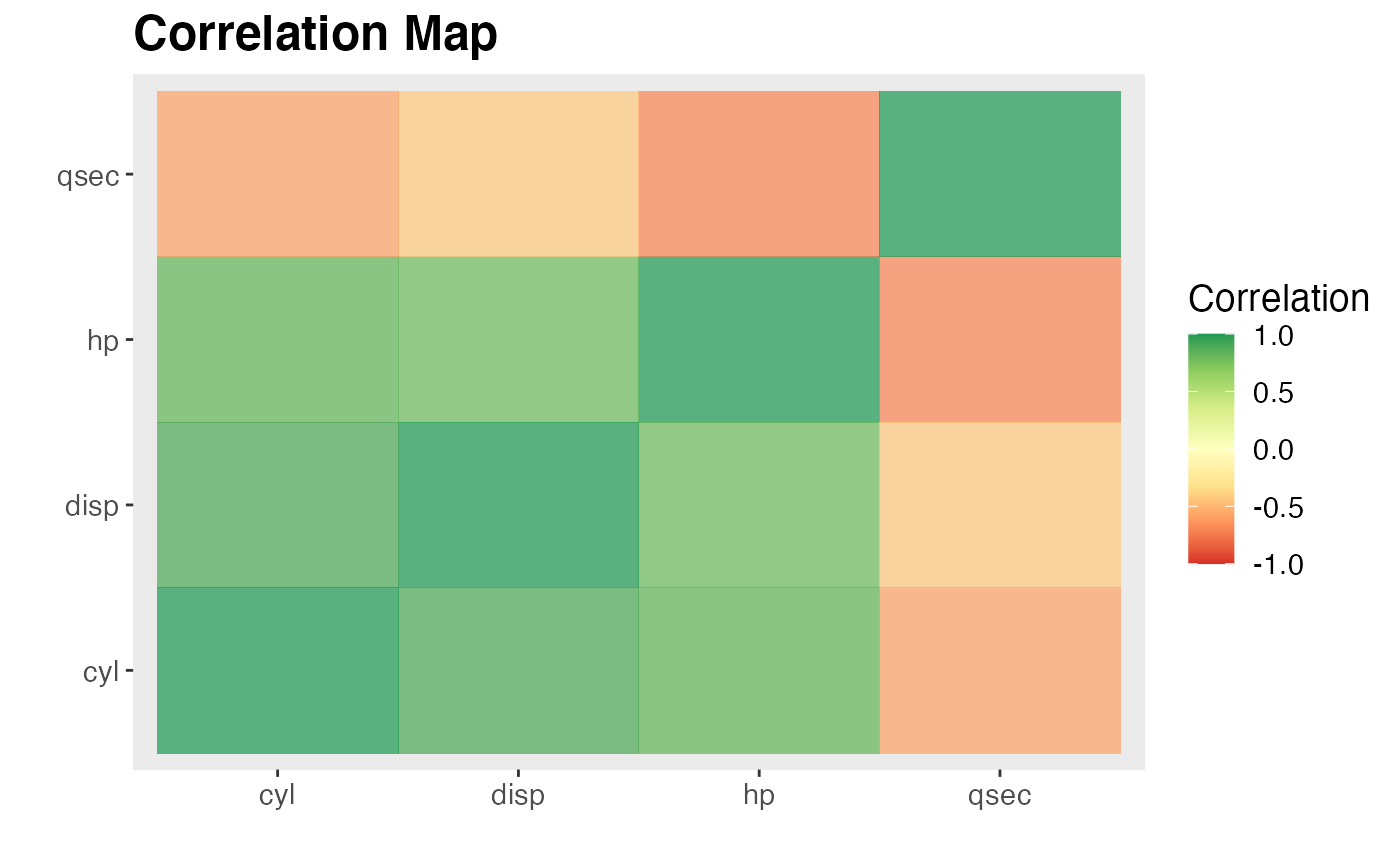
Plot a correlation map with the given tibble or dataframe object and a character vector of numerical features. Users are allowed to set multiple arguments regarding the setting of the correlation plot including correlation method, color schemes, plot width, height, and plot title.
corr_map(
  data,
  features,
  corr_method = "pearson",
  color_scheme = "RdYlGn",
  title = "Correlation Map"
)
Arguments
| data | A tibble or dataframe |
|---|---|
| features | A character vector. It contains names of numerical features in string for correlation map plotting. It should contain at least 2 numerical features. |
| corr_method | An optional character variable. The method to calculate correlation between features. The default is "Pearson", two other supported methods are "'kendall' and 'spearman'. |
| color_scheme | An optional character variable. The color scheme for the correlation map. The default is "BrBG". Other diverging color schemes can be "PiYG", "PRGn", "PuOr", etc. Other proper diverging color scheme reference can be found in https://ggplot2.tidyverse.org/reference/scale_brewer.html |
| title | An optional character variable. The title of the correlation map. The default is "Correlation Map". |
Value
corr_map A ggplot object. The correlation map plot.