Data Query
Getting the data
We want to focus on analyzing and understanding how people are currently using Git to enable Version Control System developers to develop a new tool that is more user friendly and that focuses and enhances the workflows that people are using currently. To do this we had to come up with a way to model the history of a project through time and account for things like branching (i.e working with more than one version of a file) and merging (i.e. incorporating work and changes from multiple branches). We couldn’t take into account time between commits as this would make the data too heterogeneous to reasonably analyze, and we couldn’t asume independence between the commits as they are state changes. So we turned to graphs. We represented each commit as a node in a graph and each edge as the change from one state to another. One of the challenges that this approach presents is that it focuses only on the high level activity of a repo and not the whole interaction of people with the tool (local activity).
Our first approach to get data on how people use Git was to use the GitHub API, as it provides vast access to the data in public repositories. However, we quickly hit a roadblock when it came to sampling the API. To get the data from the API you have to submit a query based on the attributes of the data you want to get back, but how could we know the attributes of the data in advance? Another limitation is the API rate limit was too low for our purposes. Based on this we decided to use GitHub Torrent instead.
GitHub Torrent is a project that monitors the GitHub public event timeline and logs all public activity in GitHub. They make their data available as a monthly dump in a MySQL database. As you can imagine, this is a huge database, so to deal with it we decided to use Google BigQuery. Google BigQuery is a platform provided by Google that lets you query big databases in an incredibly efficient manner. With all the GitHub data available we developed a strategy to sample one million projects, as well as each project’s associated commits and each commit’s associated information. To store the queried data we then used Google Bucket’s system to create a bucket to store a CSV file which we can then query from our local computers.
Visualizing the data
We visualize collections of Git commits as graphs using NetworkX, a popular Python package for analyzing and visualizing complex networks. Git commits form a directed acyclic graph (DAG) so we are visualizing them as such. Every commit is a node, and every parent-child relationship between commits is a directed edge. A node with 2 children occurs when there is a branch, and a node with 2 parents occurs when there is a merge.
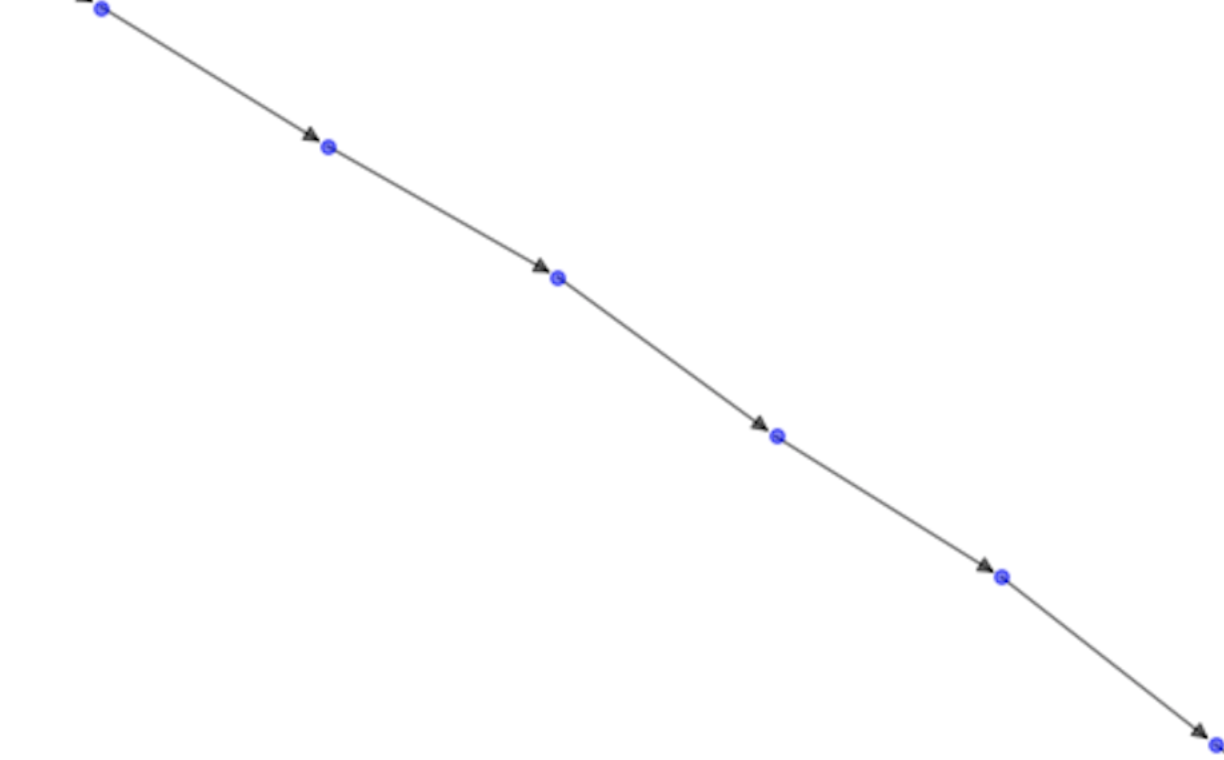
Figure: Example of Github repositories shown in NetworkX graph