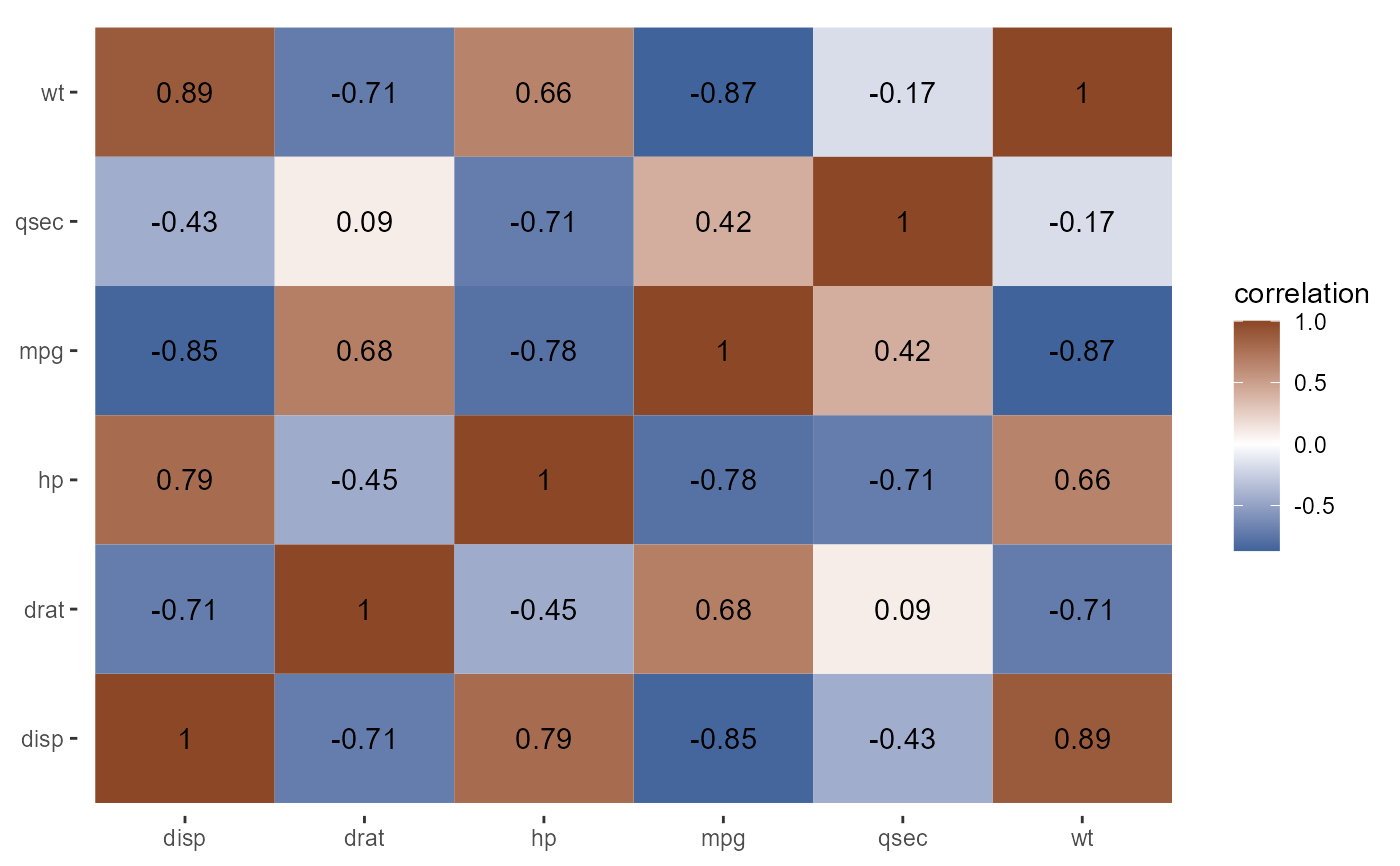
Plots the dataframe as a color-encoded Pearson correlation matrix of explanatory variables.
corr_heatmap.RdThe rows and the columns contain variable names, while the heatmap tiles contain Pearson correlation coefficient and corresponding colours.
Arguments
- df
dataframe. 2-D dataframe.
- color_neg
string. The color for the negative correlation.
- color_pos
string. The color for the positive correlation.
Examples
corr_heatmap(mtcars[, c(1,3,4,5,6,7)])