Returns a list containing a tibble that includes Variance Inflation Factor (VIF) score and a bar chart for the VIF scores alongside the specified threshold for each explanatory variable in a linear regression model.
vif_bar_plot.RdReturns a list containing a tibble that includes Variance Inflation Factor (VIF) score and a bar chart for the VIF scores alongside the specified threshold for each explanatory variable in a linear regression model.
Arguments
- x
A vector of the names of the explanatory variables.
- y
A string specifying the response variable.
- df
A tibble containing the data.
- thresh
An integer specifying the threshold.
Value
A list containing a tibble for VIFs and a bar chart of the VIFs for each explanatory variable alongside the threshold.
Examples
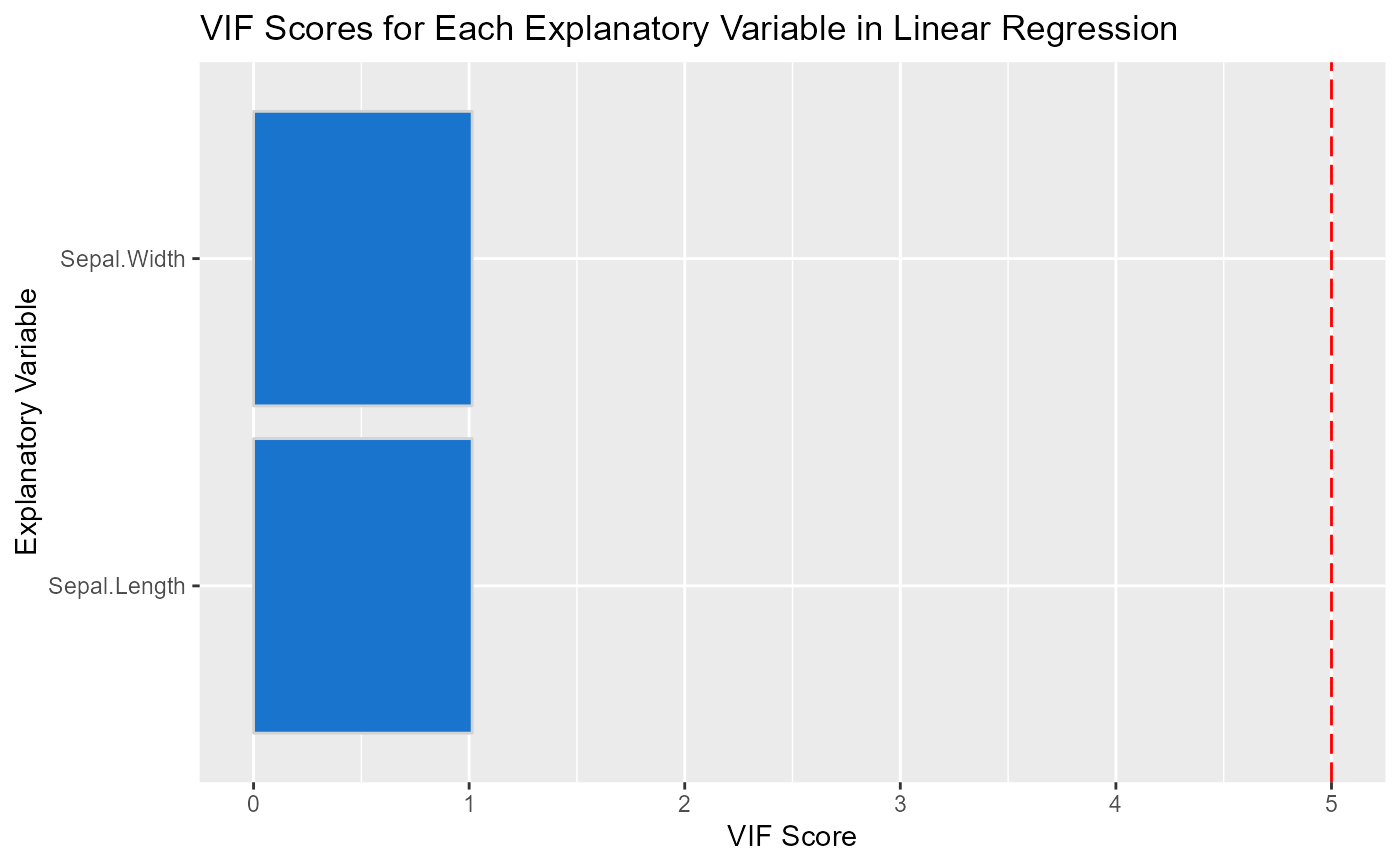
vif_bar_plot(c("Sepal.Width", "Sepal.Length"), "Petal.Width", iris, 5)
#> [[1]]
#> # A tibble: 2 x 2
#>   vif_score explanatory_var
#>       <dbl> <chr>
#> 1      1.01 Sepal.Width
#> 2      1.01 Sepal.Length
#>
#> [[2]]

#>
#>