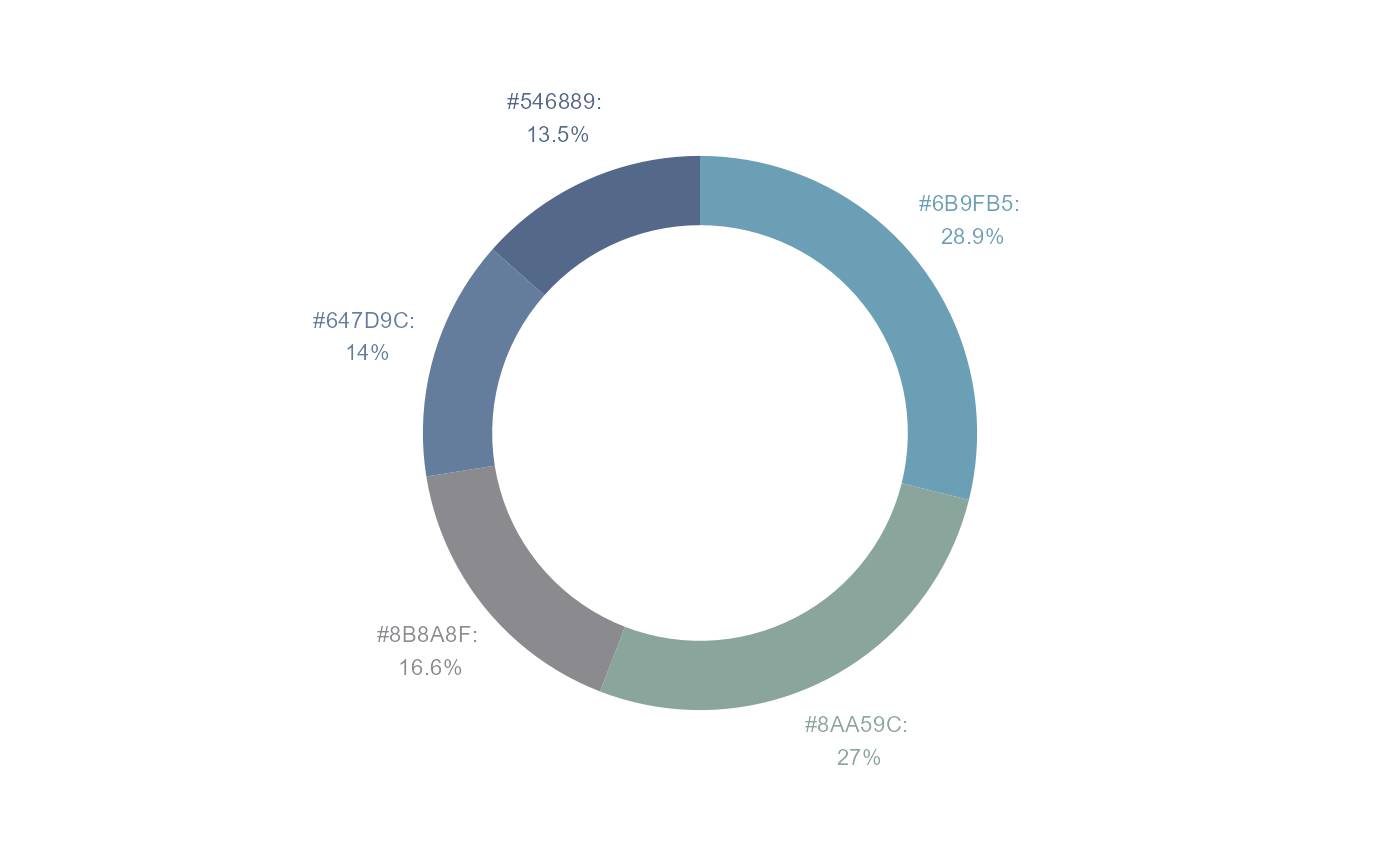
Create a donut chart of the top n colors in the image (number of colors specified by the user)
donut.RdCreate a donut chart of the top n colors in the image (number of colors specified by the user)
donut.RdCreate a donut chart of the top n colors in the image (number of colors specified by the user)