Data Analysis
Exploratory Data Analysis
In this section, we mainly focus on three sub-reddit dataset: addiction, alcoholism and anxiety, other datasets contains same column and can be analyzed
in a same way. Three cleaned datasets contain both pre and post pandemic records, as well as the feature we mainly focus on:substance_use_total.
Steps and Methods
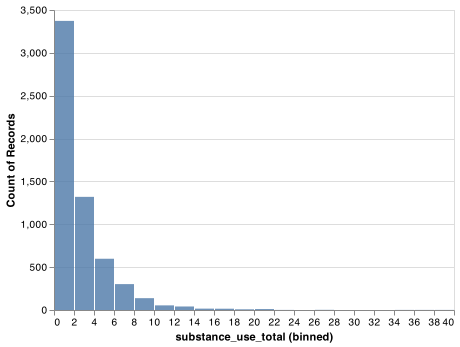
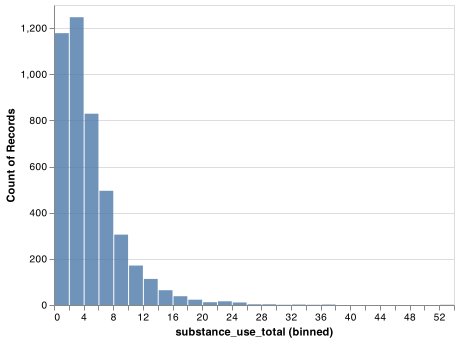
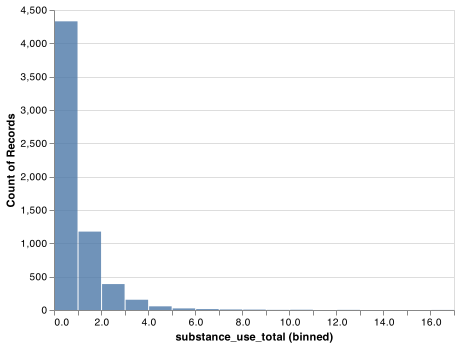
Histogram: The distribution of
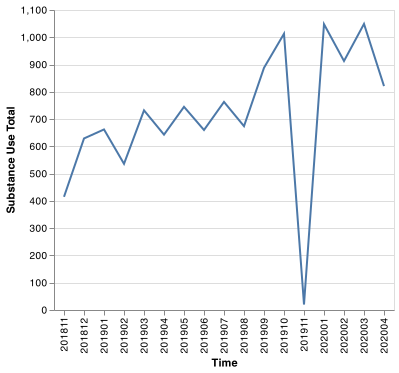
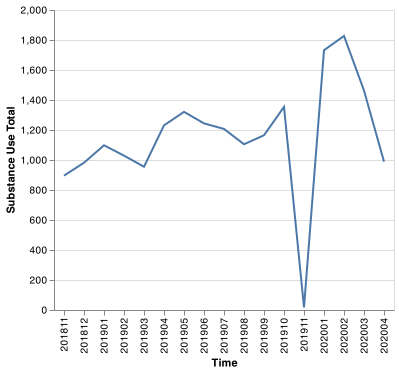
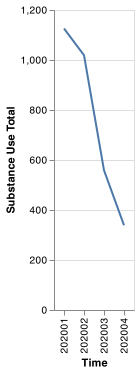
substance_use_totalbefore and after pandemic.x axis: bins.y axis: count ofsubstance_use_total. This aim to get a comparison of thesubstance_use_totalbetween th two period.Time Series Plot: The count of
substance_use_totaltrends over time(sum by month).x axis: date time.y axis: the total count ofsubstance_use_totalin a given month. This aim to get an overview of how the feature varies with time.
Summary
From the histogram above, pre COVID records is more than the post COVID records, results is not intuitive because we have only 3 months for post pandemic while 11 months for pre pandemic. For the time series plot, the records slumped at Nov, 2019. Despite of this, the count appeared to increase after Jan, 2020 in all time series plots, especially for anxiety.
The results are not convincing so that we need to conduct statistical test to see if there existed statistically signifcant significant difference between median number of references to substance abuse per reddit-post when comparing the ‘pre-COVID’ and ‘post-COVID’ datasets, and details can be found here