Predicting Customer Term Deposits
Summary
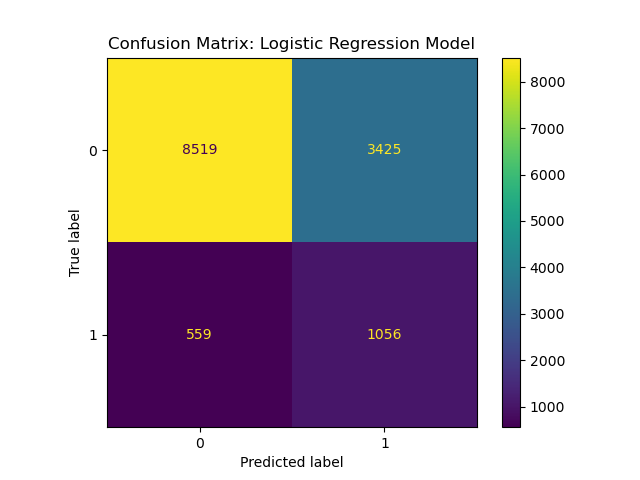
For this analysis, we built a logistic regression classification model using data from a Portuguese banking institution to predict whether a bank client will agree to open a term deposit. A term deposit is a secure investment option where individuals deposit money for a fixed term at an agreed interest rate, with the principal amount and interest paid out at the end of the term. The logistic regression model achieved a macro-average recall of 0.68, indicating moderate predictive power. While the model performs well at identifying non-subscribers, it struggles with precision (0.24) for subscribers. In the 13,564 test cases, the model correctly predicted 1,058 new subscribers, but incorrectly predicted 3525 false positives (clients predicted to subscribe when they would not). These false positives would result in additional phone calls being made, despite not leading to a successful subscription. However, by applying the model’s predictions, the number of phone calls would be significantly reduced, while the overall success rate for subscriber identification would increase to 23.09% (up from 11.78% if all 13,564 calls were made). Moving forward, improving precision should be a key focus for future modeling efforts to enhance both the accuracy and cost-effectiveness of the campaign.
Introduction
According to a poll from Investor’s Edge, the direct investing division of CIBC, 79% of Canadians acknowledge that it is important to know how to invest their money (Gonzales 2024). However, only 48% of Canadians are investing their money annually (Gonzales 2024). A large proportion of those hesitant to invest (57%) stated a fear of losing money as the reason (Gonzales 2024). It’s important for banks to understand Canadians’ investment habits in order to better provide services to support Canadians investment decisions. Keeping this in mind, many banks offer a lower risk investment option called bank term deposits.
A bank term deposit is a type of secure investment that allows individuals to deposit a lump sum amount of money for a fixed period of time (term). The period of time can range from short-term to long-term. The money is “locked in” for the duration of the term at an agreed upon interest rate. At the end of the term, the customer will receive the initial deposit along with the additional accumulated interest. It’s important to note that term deposits are very low risk and the initial investment is protected (IslandSavings n.d.).
In this analysis, we aim to determine whether a machine learning model can predict if a customer will agree to open a term deposit, using data from a Portuguese banking institution. Answering this question will be valuable for the banking institution, as it will allow them to focus their calling campaign on customers that are more likely to agree to a term deposit. This targeted approach will save valuable time and resources, as fewer customers will need to be contacted in future campaigns based on the models predictions. Additionally, this analysis will also help the bank understand their customers investment preferences, enabling them to build stronger relationship with their client-base and offer investment options that align with customer needs (S. Moro, Cortez, and Rita 2014).
Methods
Data
The dataset used in this project is from a direct marketing campaign conducted via phone calls from a Portuguese banking institution. The dataset was created by S. Moro, P. Rita, and P. Cortez and collected between May 2008 and November 2010 (R. Moro S. and Cortez 2014). Our team sourced the data from the UCI Machine Learning Repository which can be accessed directly here specifically this file. Each row in the dataset represents a bank client, with 17 features that capture aspects of the clients characteristics, as well as whether the client opened a term deposit or not. Some features are more specific to the individual (e.g. age, job, marital status and education level), while others pertain to their relationship with the bank, such as such as past interactions through previous campaigns, or the number of days since the last contact.
For our analysis, we used the following packages from the Python programming language (Van Rossum and Drake 2009): sckikit-learn (Pedregosa et al. 2011), NumPy (Harris et al. 2020), requests (Reitz 2011), zipfile (Van Rossum and Drake 2009), (McKinney 2010), matplotlib (Hunter 2007), altair (VanderPlas 2018), and seaborn (Waskom 2021).
Analysis
To prepare the dataset for analysis, we addressed missing values and removed irrelevant columns. Missing values in job and education were imputed with the mode, as their proportions were small, and mode imputation preserves their categorical nature. For contact, we visualized its relationship with the target variable (y) and found that contact method correlates with subscription rates. Based on this insight, missing values in contact were replaced with “Unknown Contact” to retain its predictive value. Columns like poutcome, which had excessive missing values (82%), were dropped to reduce noise, while duration was removed to prevent data leakage, as it directly correlates with the target variable. These cleaning decisions ensure a clean, consistent dataset, while preserving key patterns for predictive modeling.
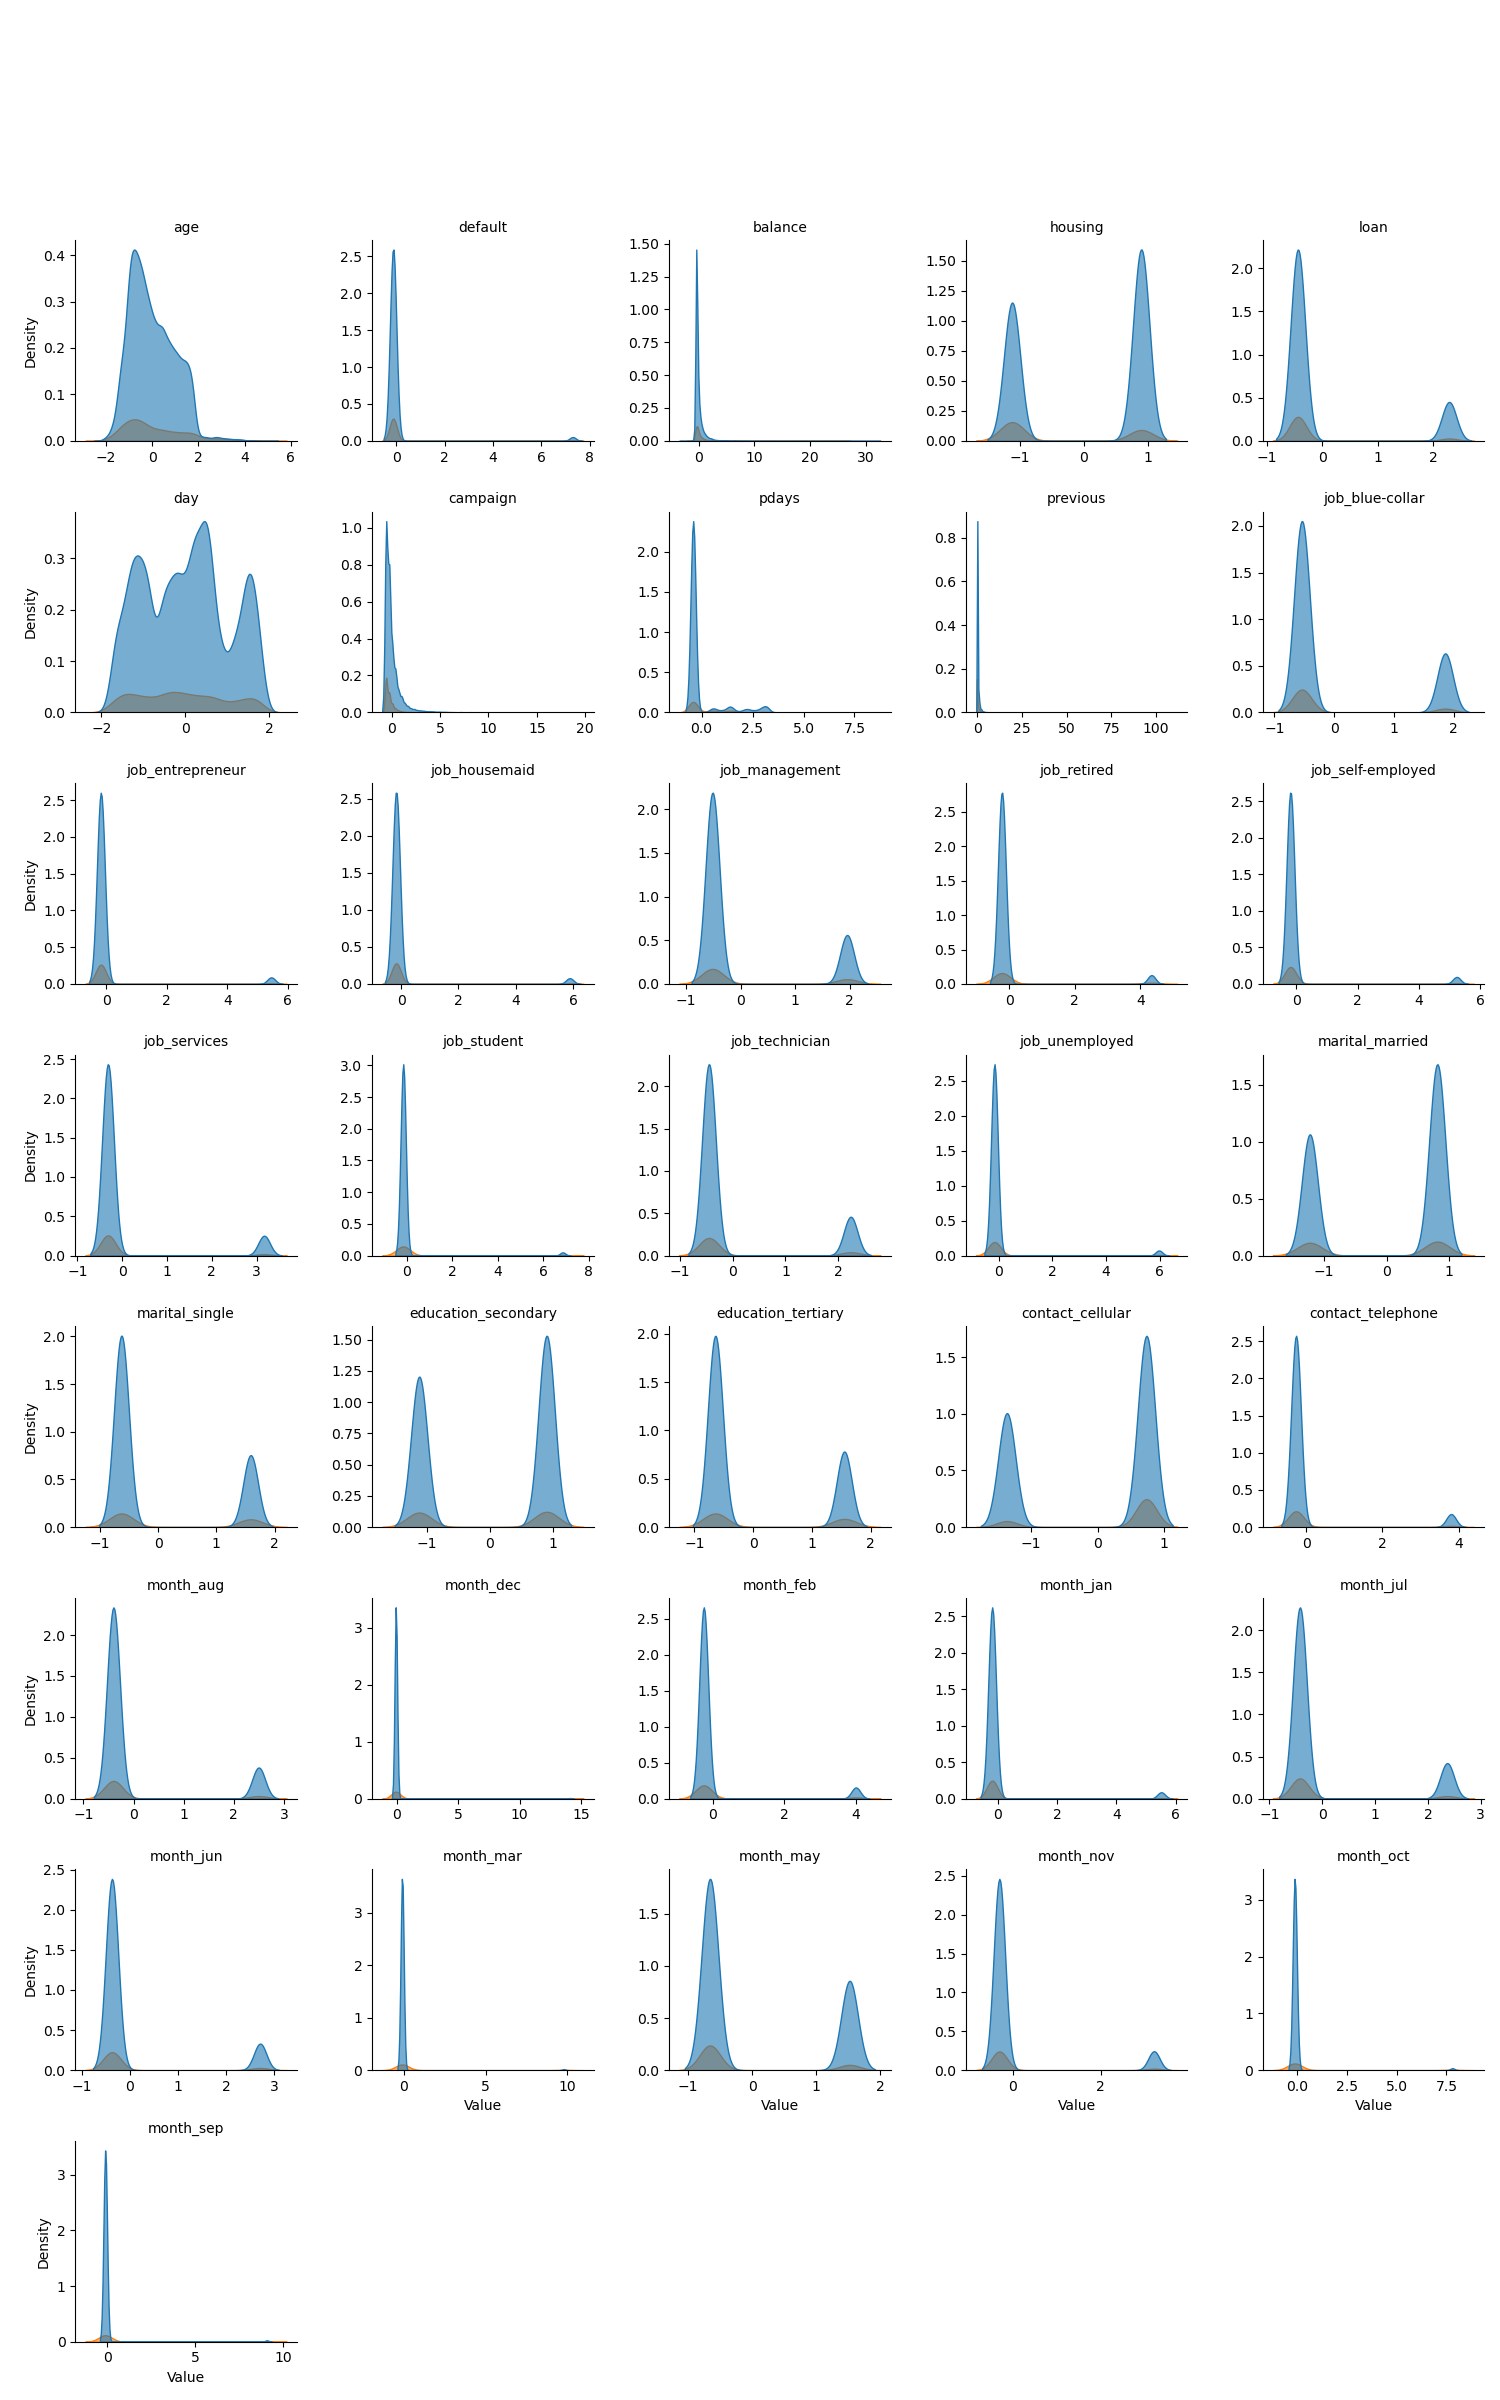
Figure 1 below shows the distribution of feature variables between non-subscribers (in blue) and subscribers (in orange). This distribution plot, along with the summary statistics provide an overview of the central tendencies, variability, and range of the numerical columns in the dataset. The age column, with a mean of 41 years and a standard deviation of 10.6, indicates a diverse range from 18 to 95 years. The balance column shows significant variability, with a wide range from -8019 to 98417 and a standard deviation over 3009, suggesting the presence of outliers. The day column, representing the last contact day, is evenly distributed across the month, while campaign has a median of 2 and a maximum of 63, showing that most clients were contacted only a few times. The pdays column has many entries with -1, likely indicating no prior contact, while previous has a low mean (0.59) but a maximum of 275, highlighting infrequent yet extreme cases. These statistics offer critical insights into the dataset’s distribution and help identify features that may need further preprocessing.
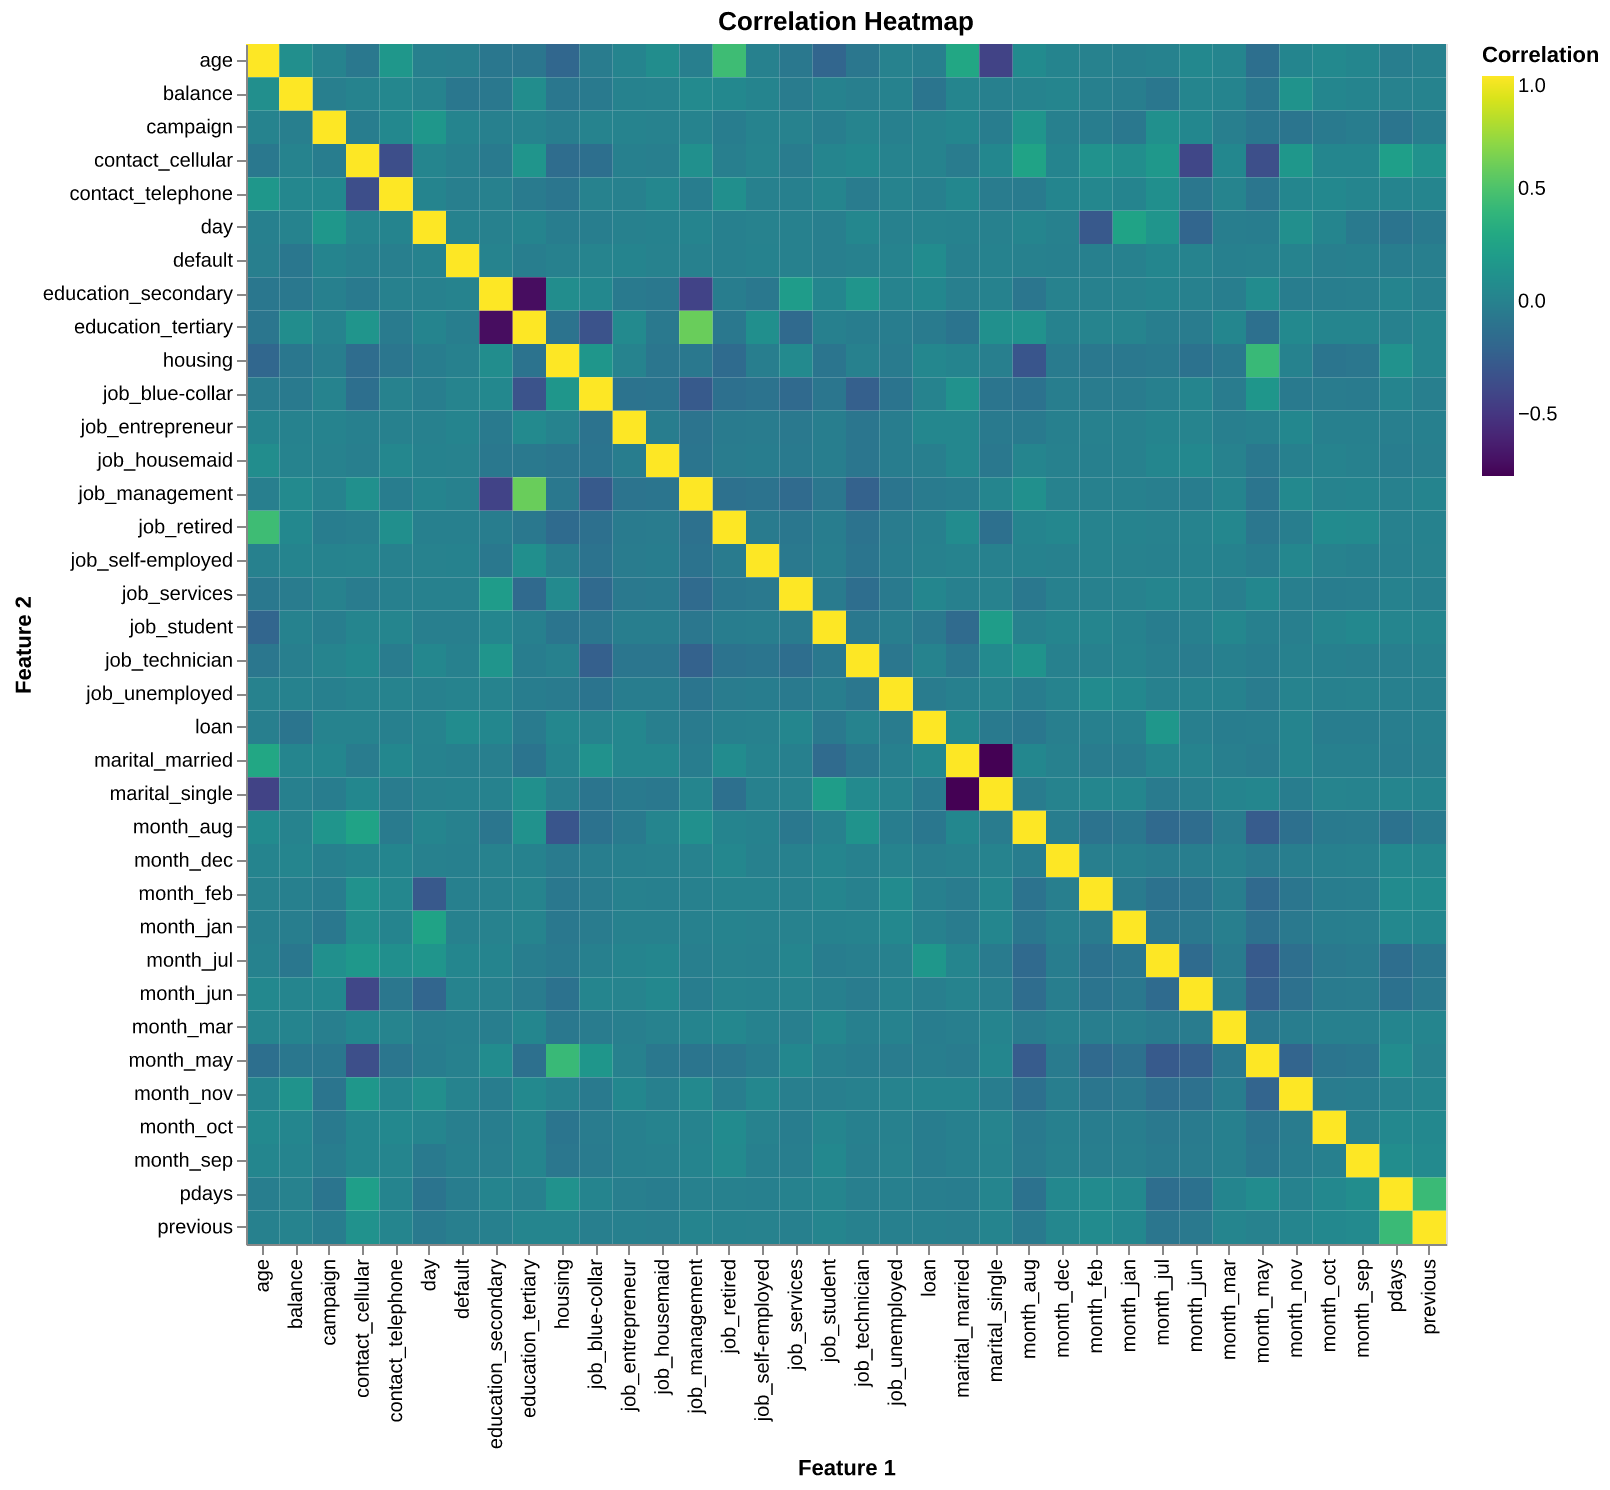
The correlation heatmap in Figure 2 reveals that most numerical features have weak or negligible correlations, indicating low multicollinearity and diverse contributions to prediction. A notable moderate correlation (0.45) exists between pdays and previous, suggesting some redundancy, but other features like age, balance, and campaign show minimal linear relationships. This suggests that the numerical features are largely independent and suitable for modeling without significant concerns about collinearity.
Results and Discussion
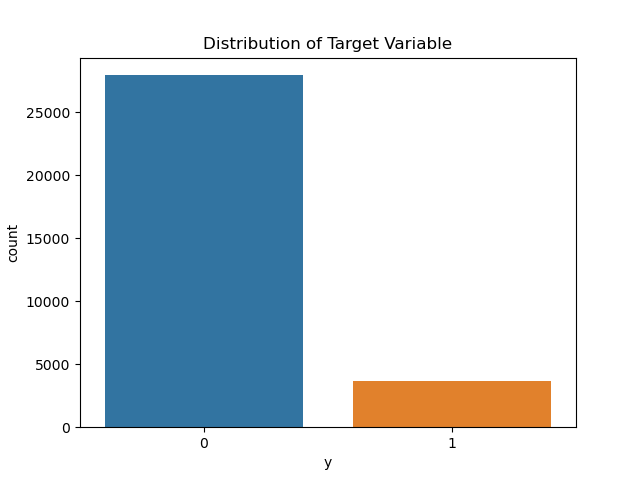
The analysis of the dataset reveals several key findings about customer behavior and the performance of the logistic regression model. The dataset comprises 45,211 records, each describing a bank customer’s characteristics and whether they subscribed to a term deposit. Notably, we can see from Figure 3 that the target variable (labeled orange) is highly imbalanced, with only 11.7% of customers subscribing. This imbalance significantly impacts the evaluation of predictive models, making metrics like precision, recall, and the AUC score crucial for assessing model performance.
The logistic regression model achieved a macro-average recall of 0.68 and an AUC score of 0.75, indicating moderate predictive power. As we can see from the Confusion Matrix in Figure 4, while the model performs well at identifying non-subscribers, it struggles with precision (0.24) for subscribers. This result aligns with expectations given the imbalanced nature of the dataset, as the model tends to predict the majority class more accurately. The class balancing approach partially mitigated this issue by improving recall for the minority class (term deposit subscribers), but precision remains a challenge.
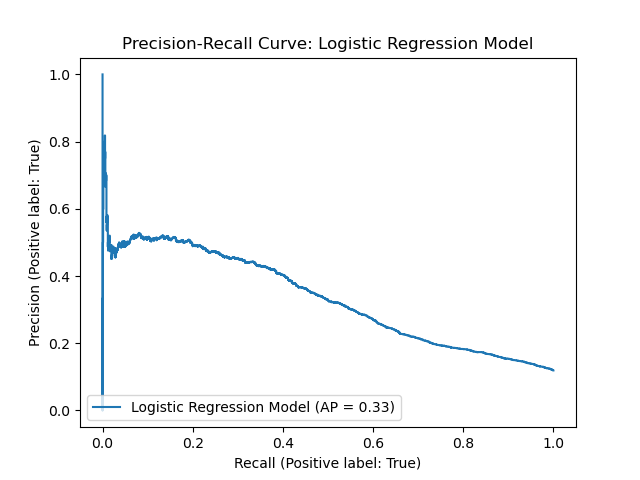
These findings have practical implications for the bank’s marketing strategy. By leveraging the model’s predictions, the bank can focus its campaigns on customers more likely to subscribe, optimizing resource allocation. However, the low precision suggests that many non-subscribers may still be targeted, potentially increasing costs and reducing campaign efficiency. Therefore, improving precision should be a focus for future modeling efforts. The Precision-Recall curve below in Figure 5 provides a visual view of the balance between precision and recall rates.
This analysis raises several questions for future research:
- Can advanced machine learning models, such as random forests or gradient boosting machines, improve predictive accuracy and precision for the minority class?
- What role do additional features, such as transaction history or customer engagement metrics, play in predicting term deposit subscriptions?
- How does the economic context (e.g., interest rates, market conditions) influence customer subscription behavior, and can external factors be integrated into the model?