Brief description
The basic way to create a reactive plot is to create a Shiny UI with the fluidPage( ) function. The UI object will set the general layout of the dashboard, and inside that we will define the input box with the numeric input, title and value (similar to Dash). We then create a server function which would take in input, output and session. Inside the function we will use a reactive( ) expression to tell the server to watch for the changes in inputs. Also, we define the output which tells the UI how to update plots, boxes or texts. We can only call the reactive( ) expression within a render function or another reactive expression.
We can create a plot reactive to more than one input by simply defining multiple inputs with the help of --Input( ) functions. Inside the server function we can call the input by calling input with the $ sign. We need to give the plot function to renderPlot( ). The plot function needs to be designed to accept multiple inputs.
To create more than one reactive output (for example, having a plot and text to print on the screen), we need to add the same input into multiple renders. For example, inside the server function, an input a can be given to to renderPlot( ), renderTable( ) or renderText( ) simultaneously. Inside the render functions we should have the functions that create the plot, table and text.
Long description
The basic way to create a reactive plot
The basic way to create a reactive plot is to create a Shiny app object with the the help of shinyApp( ) function. This function requires two basic arguments: a UI definition and a function (we name it “server” here) with 3 parameters: input, output and session.
The UI object is built with the fluidPage( ) function to set the general layout of the dashboard. Inside that we can use --Input( ) functions to define input boxes with the input variable name (inputID), the label and the value to begin with. For example, in the sample code below, one input box is defined with ‘a’ as the variable name (inputID), 10 as the start value and ‘a_label’ as the title of the box. We then define the output plots with one or more --Output( ) functions. The parameters inside the --Output( ) functions come from the server function that we define in the next step. In this specific example, we use plotOutput( ) to build a graph.
Next, we create a server function which would take in three parameters: input, output and session.
- The input parameter corresponds an object containing the input variables passed on from the UI definition.
- The output parameter is an object to be defined in this server funtion, containing the information of what we would like to plot in UI.
- The session object is an environment that can be used to access information and functionality relating to the session.
Inside the function we will use the reactive( ) function to create a reactive expression (named ‘smp’ in the below code). The purpose of this step is to tell the server to watch for the changes in inputs. Also, we define the output object with renderPlot( ) which stores a rendered plot so that we can pass it back to the UI object for display. We can only call the reactive() expression within a render function or another reactive expression.
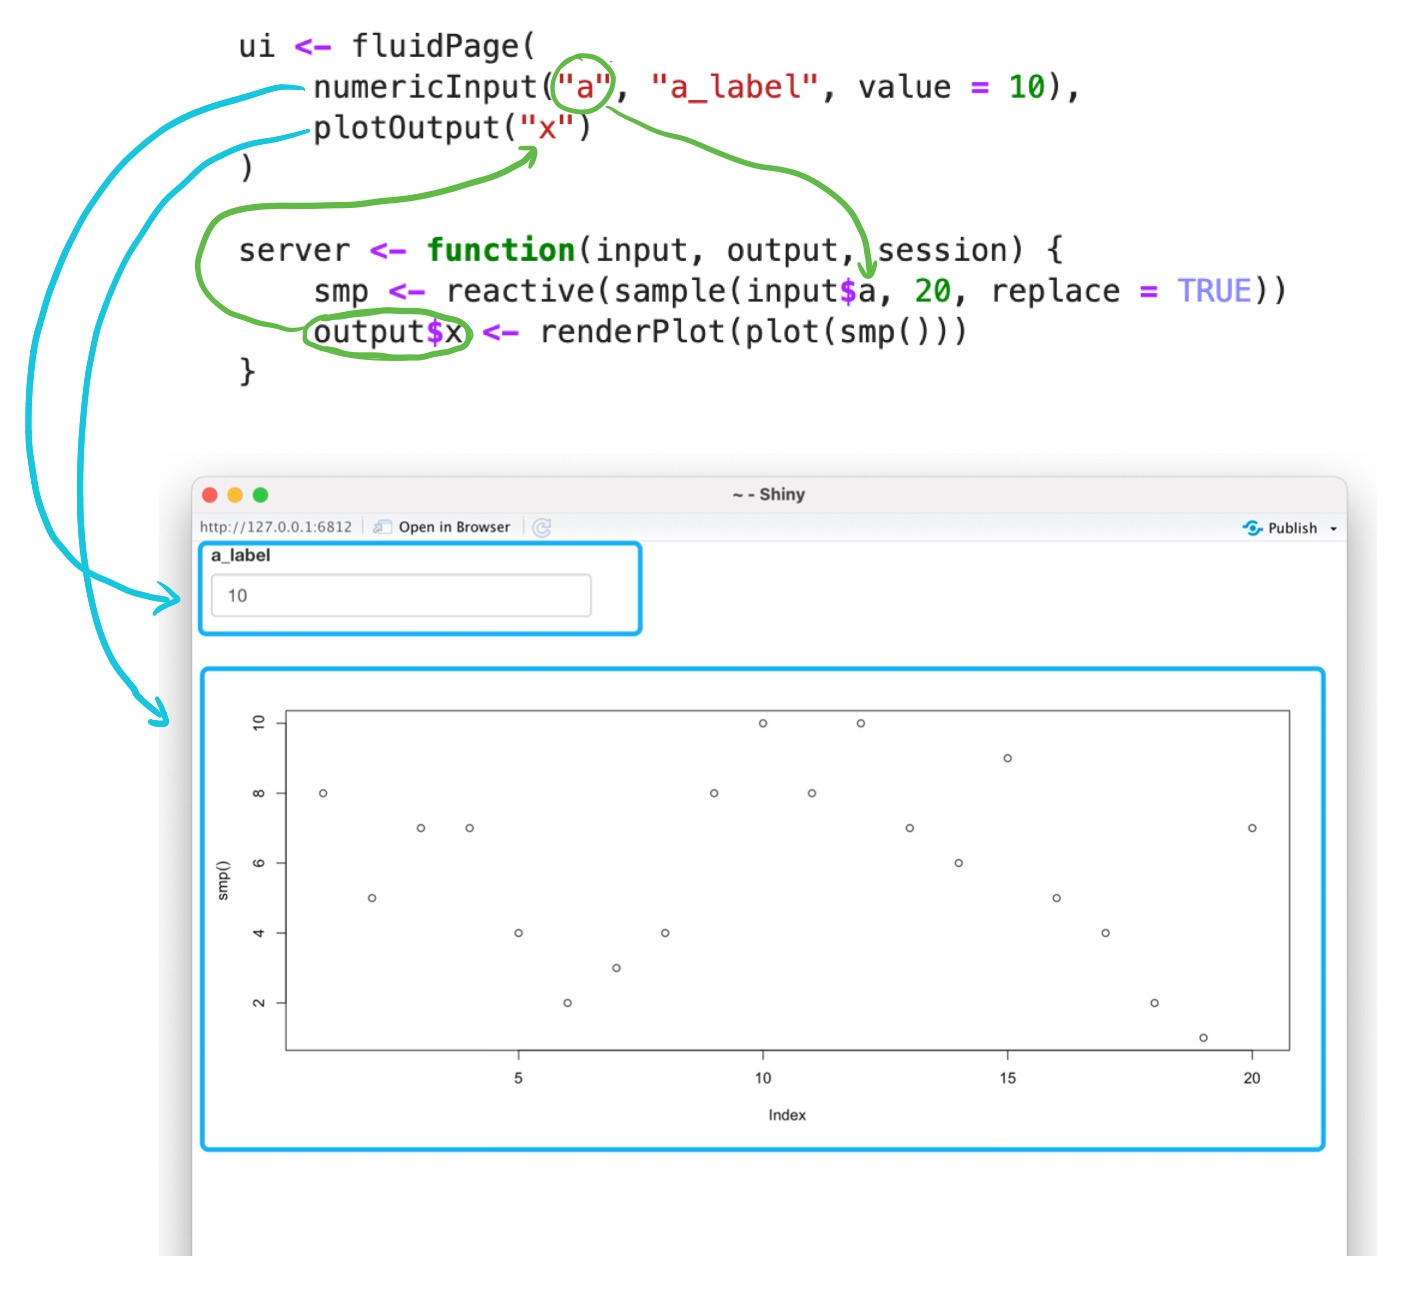
ui <- fluidPage(
    numericInput("a", "a_label", value = 10),
    plotOutput("x")
)

server <- function(input, output, session) {
    smp <- reactive(sample(input$a, 20, replace = TRUE))
    output$x <- renderPlot(plot(smp()))
}

shinyApp(ui, server)
How to create a plot reactive to more than one input
We can create a plot reactive to more than one input by simply defining multiple inputs with the help of --Input( ) functions. Inside the server function we can retrive the inputs by calling input with the $ sign. In the sample code given below, we use an additional numericInput( ) function to define another variable ‘b’ with label ‘b_label’. Other --Input( ) functions include checkboxInput( ), dateInput( ), selectInput( ), textAreaInput(), etc.
Same as above, we need to pass on the plot function along with the input data to renderPlot( ). The output plot needs to be designed to accept multiple inputs and is then given back to the UI object for display.
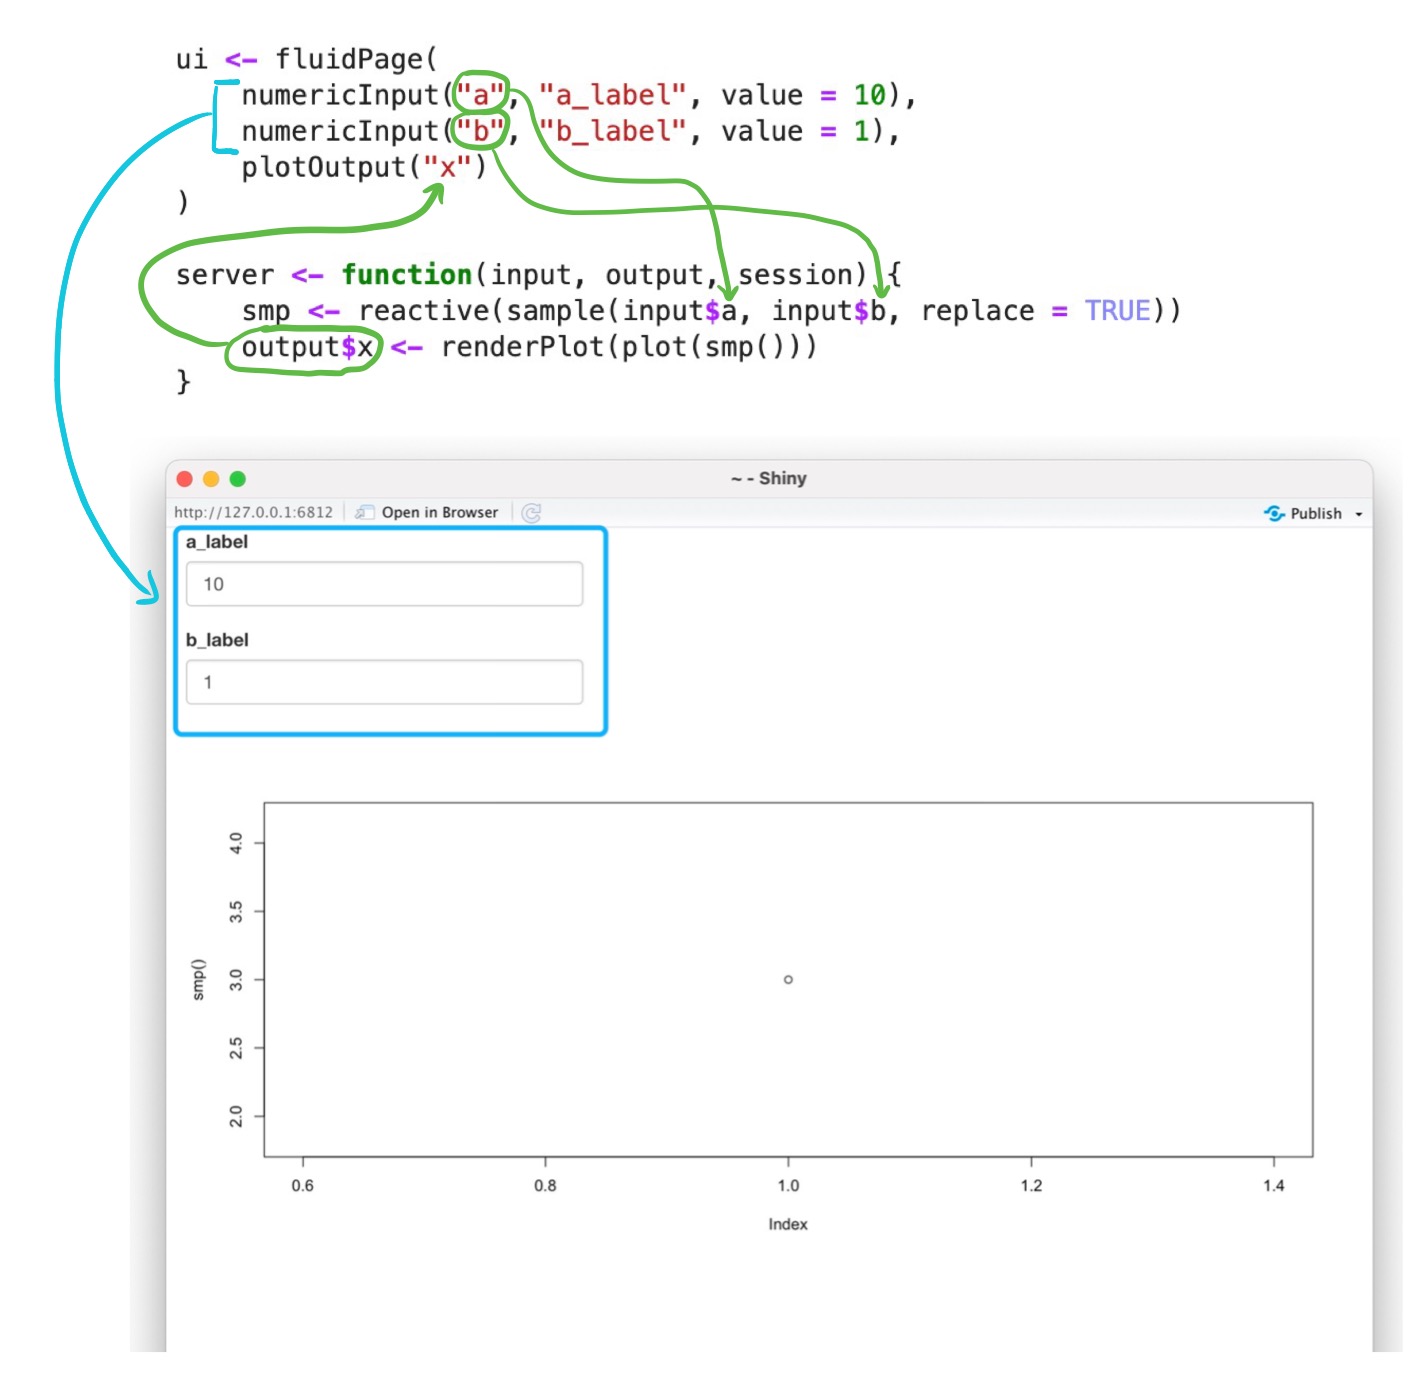
ui <- fluidPage(
    numericInput("a", "a_label", value = 10),
    numericInput("b", "b_label", value = 1),
    plotOutput("x")
)

server <- function(input, output, session) {
    smp <- reactive(sample(input$a, input$b, replace = TRUE))
    output$x <- renderPlot(plot(smp()))
}

shinyApp(ui, server)
How to create more than one reactive output
To create more than one reactive output (for example, having a plot, a table and text to print on the screen), we need to add the same input into multiple renders. Specifically, inside the server function below, the passed-on input(s) can be assigned to renderPlot( ), renderTable( ) and renderText( ) simultaneously. After that, we send the output plot, table and text back to the corresponding --Output( ) functions inside the UI object so that they can be displayed in the layout. Other --Output( ) functions include imageOutput( ), verbatimTextOutput( ), htmlOutput( ), uiOutput( ), etc.
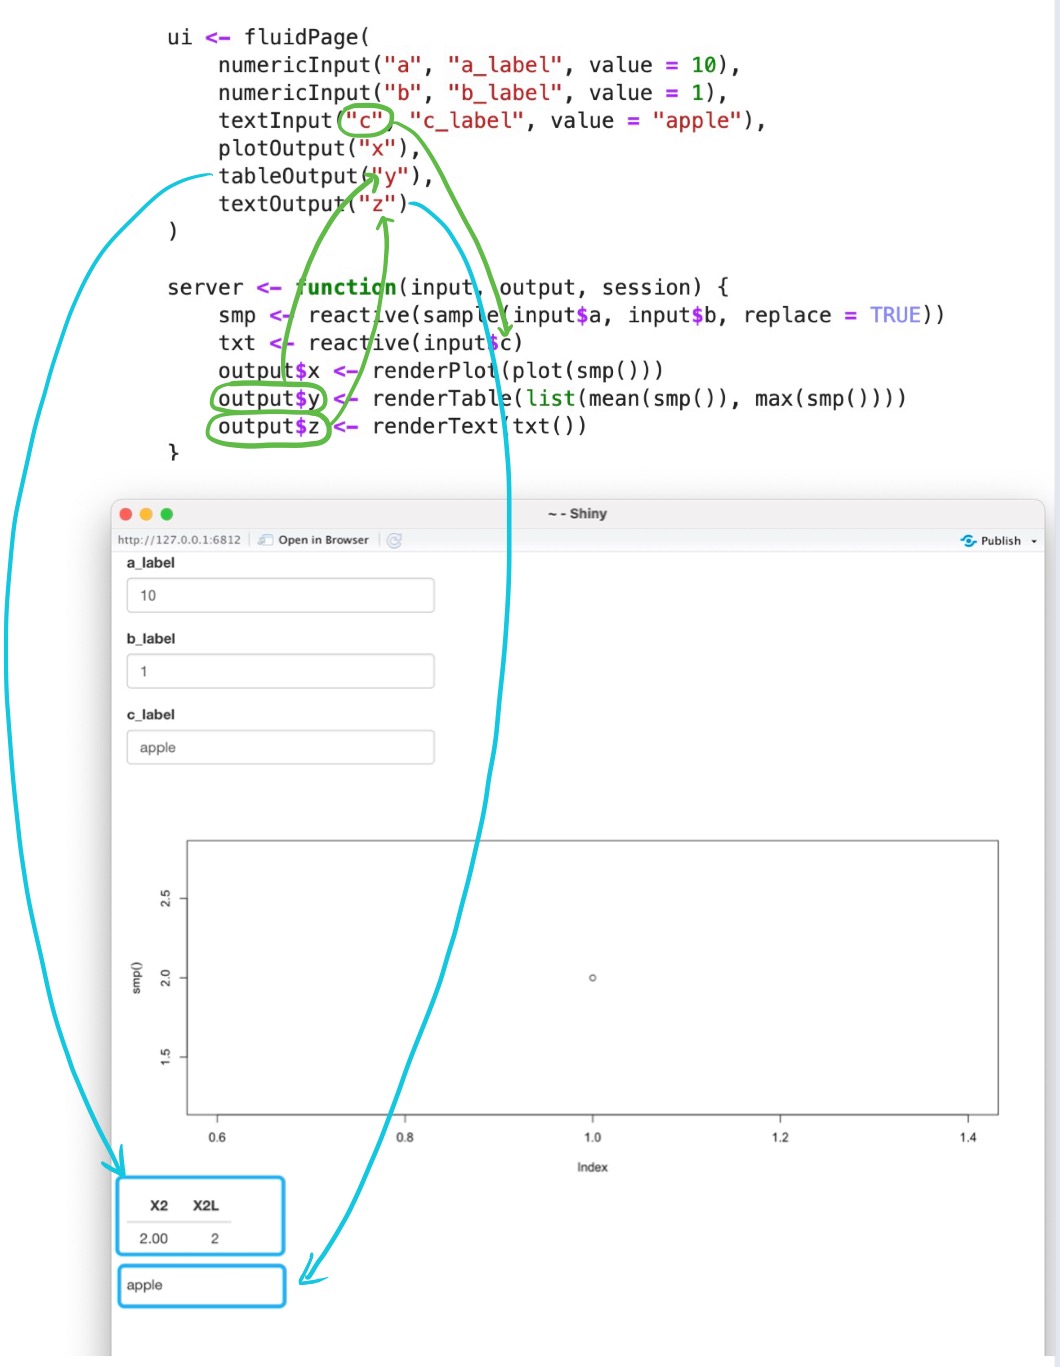
ui <- fluidPage(
    numericInput("a", "a_label", value = 10),
    numericInput("b", "b_label", value = 1),
    textInput("c", "c_label", value = "apple"),
    plotOutput("x"),
    tableOutput("y"),
    textOutput("z")
)

server <- function(input, output, session) {
    smp <- reactive(sample(input$a, input$b, replace = TRUE))
    txt <- reactive(input$c)
    output$x <- renderPlot(plot(smp()))
    output$y <- renderTable(list(mean(smp()), max(smp())))
    output$z <- renderText(txt())
}

shinyApp(ui, server)
Links
- https://mastering-shiny.org
- https://mastering-shiny.org/basic-reactivity.html
- https://shiny.rstudio.com/tutorial/written-tutorial/lesson6/
- https://mastering-shiny.org/reactive-graph.html
- https://shiny.rstudio.com/reference/shiny/latest/session.html