fit and plot DBSCAN clustering on numeric columns of the dataset
explore_DBSCAN_clustering.Rdfit and plot DBSCAN clustering on numeric columns of the dataset
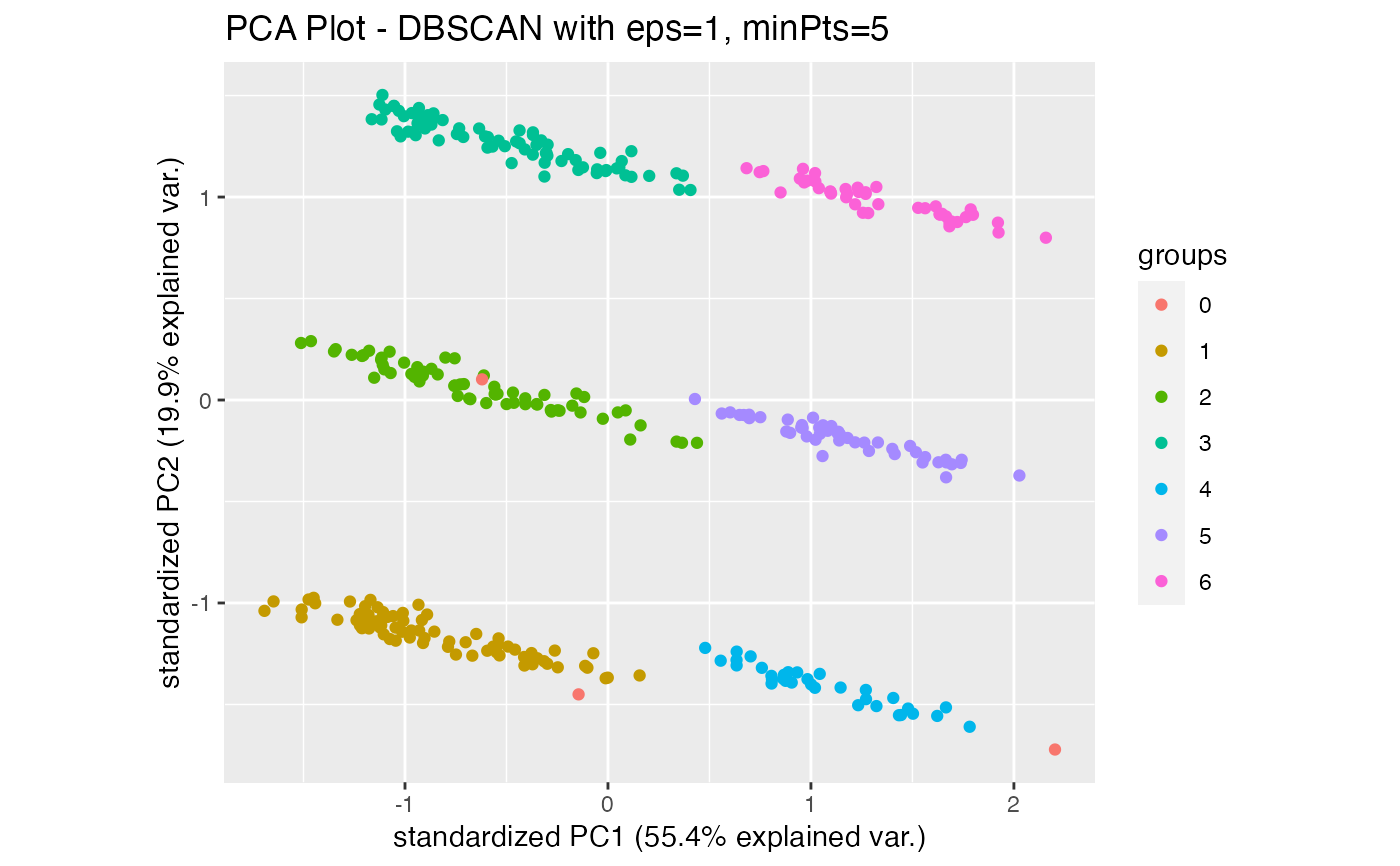
explore_DBSCAN_clustering(df, eps = c(1), minPts = c(5))
Arguments
| df | dataframe: dataset |
|---|---|
| eps | vector of the epsilon neighborhood size, optional, default to c(1) |
| minPts | vector of number of minimum points in the eps region (for core points), default to c(5). |
Value
a list of plots
Examples
#> [[1]]#>