Performs EDA of categorical features.
explore_categorical_columns.RdCreates a data frame containing column names and corresponding details about unique values, null values and most frequent category in every column Plots count-plots for given categorical columns
explore_categorical_columns(df, categorical_cols)
Arguments
| df | input data as a data frame |
|---|---|
| categorical_cols | vector containing categorical columns |
Value
A list object with first list element being a tibble with details about unique, null values and most frequent category in every column and a second list element being count plots of user provided column names
Examples
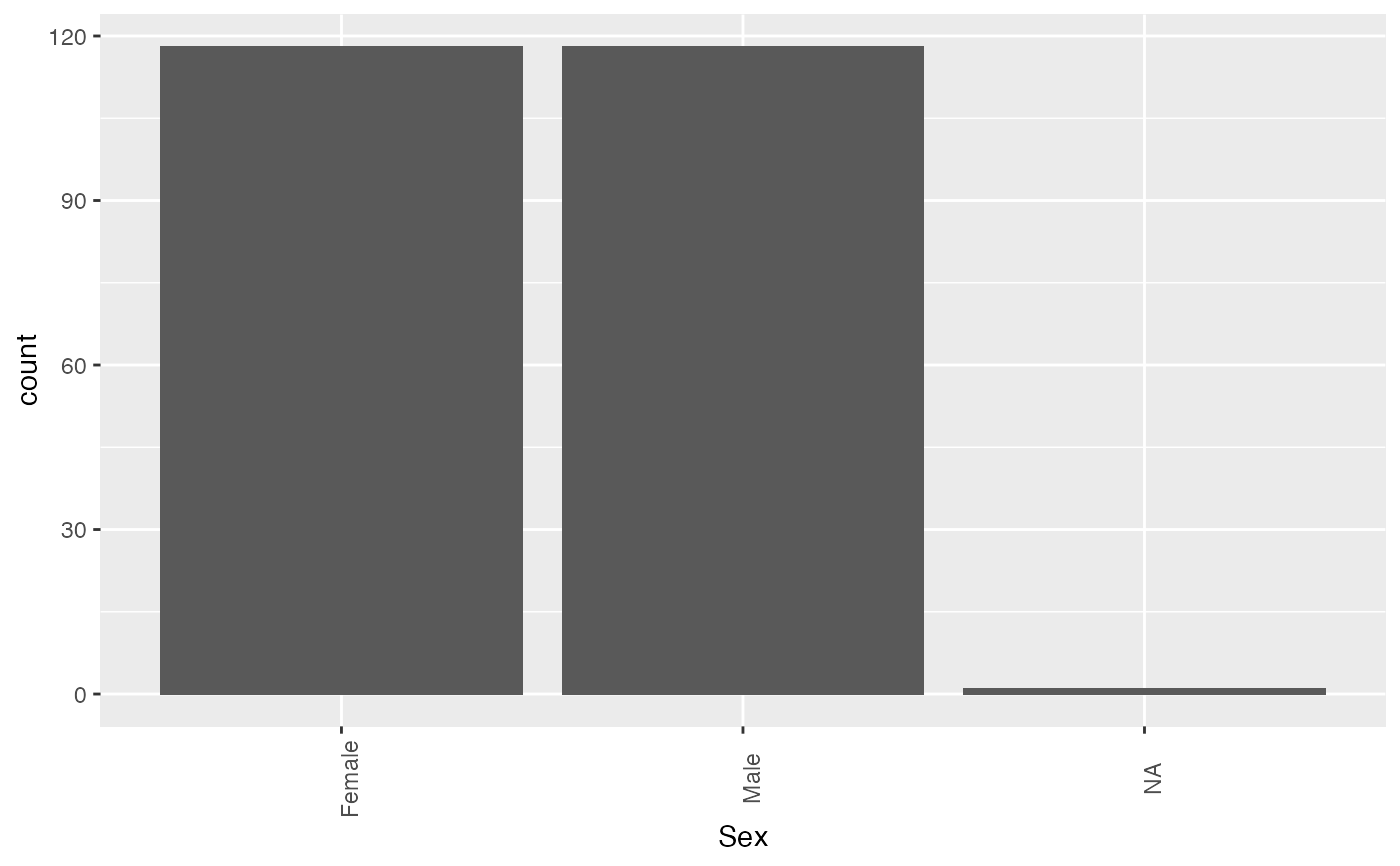
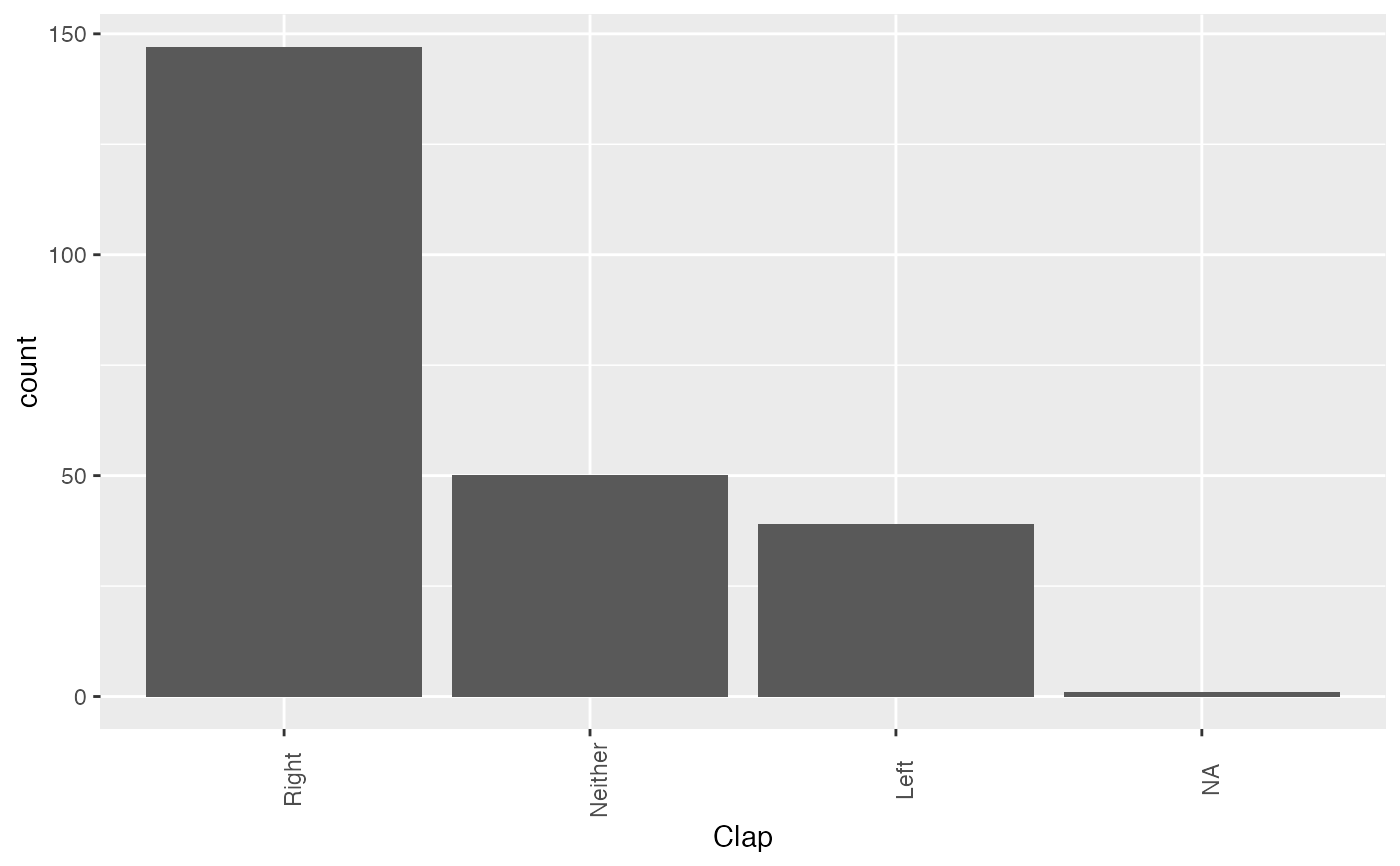
#> #>#> #> #> #>#> #> #>#> #> #>#> #>#> #> #>library(knitr) df <- data.frame(lapply(survey[, c('Sex','Clap')], as.character), stringsAsFactors=FALSE) %>% tibble() results <- explore_categorical_columns(df, c('Sex','Clap')) results[[1]] %>% knitr::kable()#> #> #> |column_name |unique_items | no_of_nulls| percentage_missing| #> |:-----------|:------------------------|-----------:|------------------:| #> |Sex |Female, Male, NA | 1| 0.422| #> |Clap |Left, Neither, Right, NA | 1| 0.422|results[[2]][[1]]results[[2]][[2]]