A function that generates a correlation plot for a list of features in a given data frame.
Source:R/corr_plot.R
corr_plot.RdA function that generates a correlation plot for a list of features in a given data frame.
corr_plot(data, features = NULL, method = "pearson")
Arguments
| data | The input data frame for plotting. |
|---|---|
| features | A vector of characters that represents the features names. By default, NULL (returns plot of all numeric features). |
| method | The correlation method that includes: 'pearson', 'spearman' or 'kendall'. By default 'pearson'. |
Value
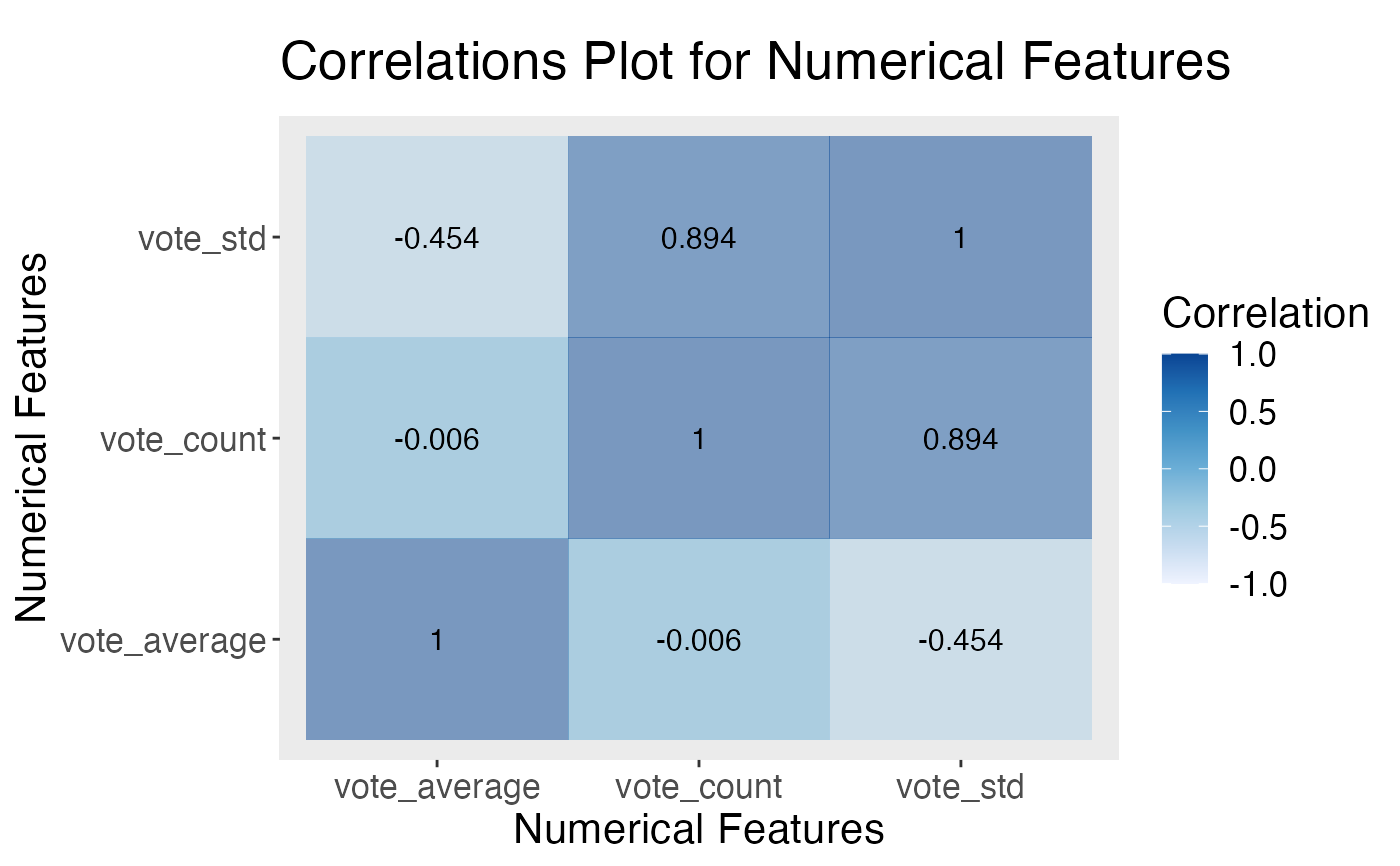
ggplot object, a correlation plot that illustrates the correlation between numeric features interactively.
Examples
data <- data.frame('Title' =
(c("Finding Nemo", "Dunkirk", "Denial")),
 'vote_average' = (c(3.86, 4.11, 3.62)),
  'vote_count'= (c(33887, 282, 68)), 'vote_std'= (c(0.87, 0.78, 0.82)))
numerical_features <- c('vote_average','vote_count','vote_std')

corr_plot(data, features = numerical_features, method = 'spearman')