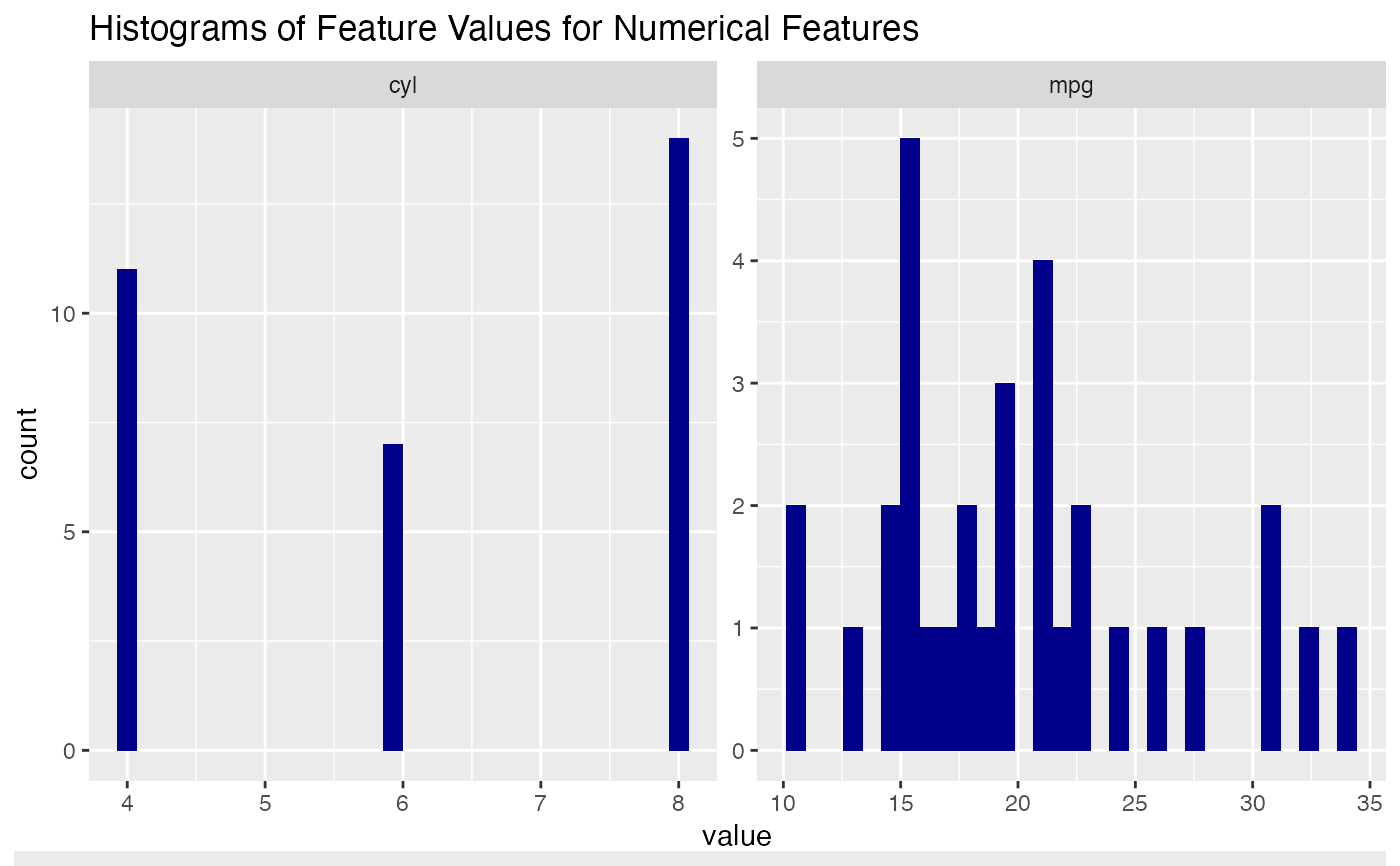
Will plot histograms for numerical features, bar charts for categorical.
histograms(data, features, num_cols = 2)
Arguments
| data | data.frame like object to plot histograms/bar charts |
|---|---|
| features | Which features from |
| num_cols | Number of columns in facetted chart produced |
Value
ggplot2 object