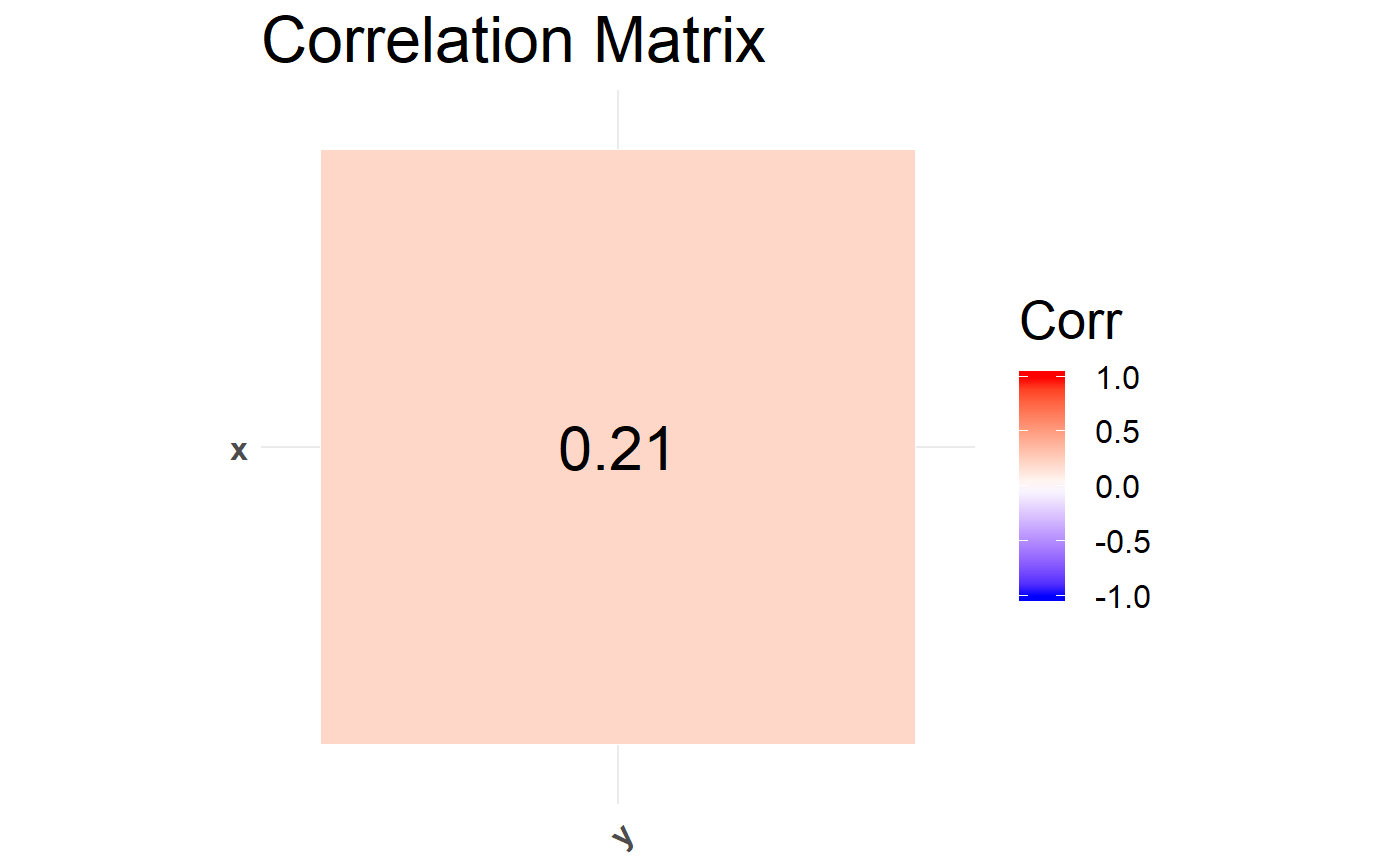
Evaluates the correlation between the numeric columns of a given dataframe.
Source:R/eda.R
calc_cor.RdEvaluates the correlation between the numeric columns of a given dataframe.
calc_cor(df, num_vars)
Arguments
| df | The dataframe to be inspected. |
|---|---|
| num_vars | A list of strings of column names containing numeric variables. |
Value
ggplot object; a correlation matrix plot labelled with the correlation coefficients of -1 to 1 between each numeric column and other numeric columns in the dataframe.
