Provides statistical summary of the numeric variables for a dataframe, such as the mean, median, maximum and minimum for the numeric variables.
Source:R/eda.R
describe_num_var.RdProvides statistical summary of the numeric variables for a dataframe, such as the mean, median, maximum and minimum for the numeric variables.
describe_num_var(dataframe, num_vars)
Arguments
| dataframe | tbl. The dataframe to be inspected. |
|---|---|
| num_vars | vector of character strings of the names of the numeric variables the user want to explore. |
Value
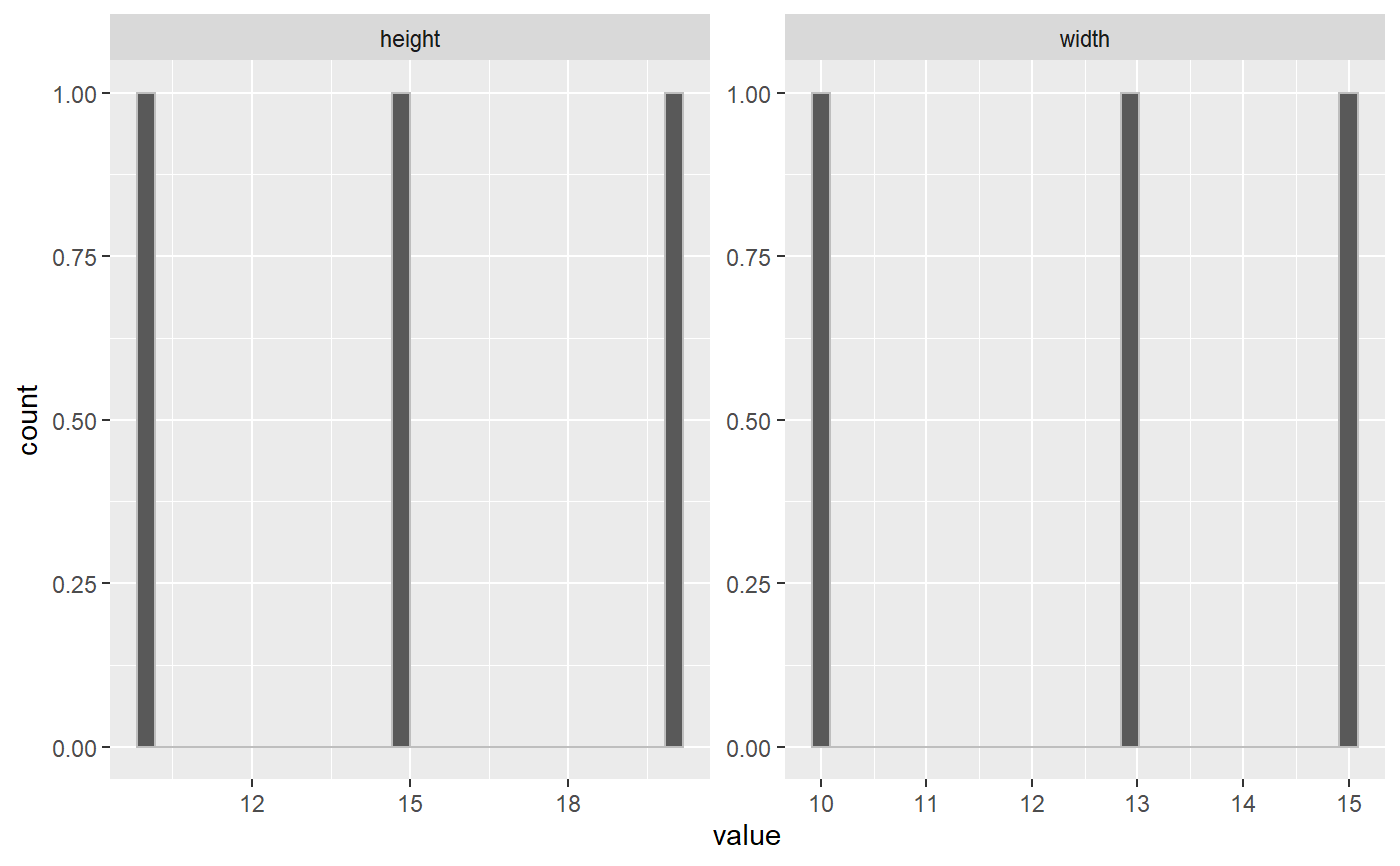
list. A list containing a dataframe with a statistical summary and a ggplot object with histograms of numeric variables faceted by each variable.
Examples
X <- dplyr::tibble(type = c('Car', 'Bus', 'Car'), height = c(10, 20, 15), width = c(10, 15, 13)) num_vars <- c('height', 'width') result <- describe_num_var(X, num_vars) result$summary#> # A tibble: 7 x 3 #> summary height width #> <chr> <chr> <chr> #> 1 25% 12.5 11.5 #> 2 75% 17.5 14 #> 3 min 10 10 #> 4 max 20 15 #> 5 median 15 13 #> 6 mean 15 12.667 #> 7 sd 5 2.517result$plot
