English Language Learning Ability Prediction Model#
by Atabak Alishiri, Rachel Bouwer, Farrandi Hernando, and Salva Umar
2023/12/09
Imports#
Show code cell source
import pandas as pd
from myst_nb import glue
Show code cell source
correlation_matrix_df = pd.read_csv("../results/tables/correlation-matrix.csv", index_col=0)
glue("correct_age_correlation", correlation_matrix_df.loc['age', 'correct'], display=False)
glue("correct_Eng_start_correlation", correlation_matrix_df.loc['Eng_start','correct'], display=False)

ridge_scores_df = pd.read_csv("../results/tables/ridge_top_models.csv", index_col=0)
glue("ridge-best-alpha_cv", ridge_scores_df.loc['param_ridge__alpha', '1'], display=False)
glue("ridge-best-error-cv", -ridge_scores_df.loc['mean_test_RMSE', '1'], display=False)
glue("ridge-best-error-percentage-cv", (-ridge_scores_df.loc['mean_test_RMSE', '1'])*100, display=False)
glue("ridge-best-score-cv", ridge_scores_df.loc['mean_test_R squared', '1'], display=False)
glue("ridge-best-score-percentage-cv", (ridge_scores_df.loc['mean_test_R squared', '1'])*100, display=False)
ridge_scores_df = ridge_scores_df.style.format().hide()
glue("ridge_cv_df", ridge_scores_df, display=False)

lasso_scores_df = pd.read_csv("../results/tables/lasso_top_models.csv", index_col=0)
glue("lasso-best-alpha_cv", lasso_scores_df.loc['param_lasso__alpha', '1'], display=False)
glue("lasso-best-error-cv", -lasso_scores_df.loc['mean_test_RMSE', '1'], display=False)
glue("lasso-best-score-cv", lasso_scores_df.loc['mean_test_R squared', '1'], display=False)
lasso_scores_df = lasso_scores_df.style.format().hide()
glue("lasso_cv_df", lasso_scores_df, display=False)

best_test_score_df = pd.read_csv("../results/tables/test-score.csv")
glue("best_test_score_r2", best_test_score_df["r2"][0], display=False)
glue("best_test_score_mape", best_test_score_df["mape"][0], display=False)
glue("best_test_score_mse", best_test_score_df["mse"][0], display=False)
glue("best_test_score_rmse", best_test_score_df["rmse"][0], display=False)
glue("best_test_score_rmse_percentage", (best_test_score_df["rmse"][0])*100, display=False)
glue("best_test_score_r2_percentage", (best_test_score_df["r2"][0])*100, display=False)
Summary#
In this report we attempt to build a prediction model using linear regression models to predict an individual’s English Proficiency Score based on factors such as age, education, and language background. Our final regression model used Ridge linear regression trained wth L2 regularization and was found to have an optimal alpha value of 1.546352. The performance of our model was scored across two metrics - R-squared score and Root Mean Squared Error (RMSE). Our model had a R-squared value of 0.2424, indicating that 24.2428% of the variance in the correct English Proficiency Score is associated with the features in our model and our RMSE of 0.052821 suggested that, on average, our predictions have an error of 5.2821%. We analyzed the learned coefficients to determine the most. Looking at our predicted scores and the associated true English Proficiency Scores, we observed that our model performed better for higher actual English Proficiency Scores. This prediction could therefore be used in an informal setting for screening of proficiency based on certain factors - where the predicted score its just used as a baseline. The model may be useful in the initial analysis of individuals wanting to learn English - for example as a tool to allocate the appropriate amount of resources or suggest a certain level of guidance to an individual to best facilitate their English learning. We also interpreted the learned coefficients for our model which found that the most important features in our dataset associated with English Proficiency Scores is the Eng_little encoding which indicates the individual’s current level of English (e.g., native, immersion learner, non-immersion learner).
Introduction#
Background#
In an increasingly interconnected world, the mastery of English language skills has ascended to critical importance. English frequently functions as the common medium of exchange in global commerce, education, and cross-border dialogue. This surge in demand has spurred extensive research into understanding the factors that contribute to successful English language learning. Various studies have explored a range of determinants, including age, educational background, language exposure, and the presence of learning disabilities like dyslexia [Ellis and Wulff, 2015].
The concept of a critical period for language acquisition, a time during which learning a language is considerably easier and more effective, has been a focal point of debate and investigation. Research in this domain often leverages extensive datasets to analyze these factors and predict language learning outcomes, providing valuable insights for educators and learners alike.
The dataset used in this study offers a rich collection of data points encompassing various demographic and linguistic variables. It includes information on native languages, the age of English language learning initiation, years spent in English-speaking environments, and the presence of psychiatric disorders or reading difficulties. This comprehensive dataset facilitates a nuanced exploration of how these diverse factors interplay to influence English language proficiency.
By employing machine learning techniques and statistical analysis, this project aims to predict an individual’s proficiency in English, contributing to the broader understanding of language acquisition and offering practical applications in educational settings.
Research Question#
Can we predict an individual’s English proficiency score based on factors such as age, education, and language background?
Dataset#
The dataset [Hartshorne, 2020] is associated with the study “A Critical Period for Second Language Acquisition: Evidence from 2/3 Million English Speakers,” authored by Joshua Hartshorne, Joshua Tenenbaum, and Steven Pinker [Hartshorne et al., 2018]. It includes demographic variables, language exposure details, and responses to critical questions. The dataset encompasses a wide range of languages, educational backgrounds, and living environments and the analysis primarily focuses on monolinguals, immersion learners, and non-immersion learners, providing valuable insights for language acquisition.
This dataset is publicly available and consists of a substantial collection of data points, totaling 671.5MB in size. The repository includes several key components:
Compiled.csv: This file contains the raw data, including subjects and items that were later excluded from the analysis.
Data.csv: This file features only the subjects and items that were analyzed in the study.
Processing.R: An R script included in the repository is used for converting data from the compiled.csv file into the format present in the data.csv file.
The dataset covers a range of variables, such as:
Basic Information: Unique subject ID, date and time at the start of the experiment, gender, and age.
Language Details: Native languages (natlangs), primary language currently used (primelangs), and age at which English learning started (Eng_start).
Living and Education Background: Years living in English-speaking countries, living with native English speakers, highest level of education, and countries lived in.
Psychiatric and Reading Difficulties: Reports of any psychiatric disorders and difficulties with reading (dyslexia).
Experiment-specific Information: Use of a dictionary in the experiment, prior participation in the experiment, and percentage of critical items answered correctly.
Additionally, there are columns for responses to individual questions in the experiment. We will explore the dataset in detail below.
Note: Due to this analysis being conducted in the context of the Milestones, we limited the analysis to 200,000 rows to ensure that the analysis would run quickly and to ensure that do not exceed the 100MB limit for simplicity. We selected the rows through random sampling (the script used can be found as notebooks/random_sampling_from_full_dataset.ipynb).
Methods and Results#
In order to address our research question, we will first select the appropriate features from our dataset by way of EDA and by referring to the data dictionary to better understand the instances in the dataset ( dataset information is linked in references). Additionally, since this will be a linear regression modelling problem, we will use the Ridge and Lasso Model as our models of choice, we will assess their ability by using the \(R^2\) and negative Root Mean Squared Error to ensure we use two different types of metrics to assess the variability in the predictions from the actual target.
The initial steps involved extensive data preprocessing, which included handling missing values, standardizing numerical features, and encoding categorical variables. To enhance model interpretability, we categorized education levels into major groups, consolidating less frequent categories as “Others.”
We constructed a column transformer, tailored to the nature of each feature type, incorporating standard scaling for numeric attributes, one-hot encoding for categorical variables, and specific treatments for binary features. Further, a custom function was used to map less frequent education categories to an “Others” label.
The Ridge model, chosen as the optimal one, underwent hyperparameter tuning via randomized search. The performance was assessed using (negative) Root Mean Squared Error (neg-RMSE) and R-squared metrics, providing valuable insights into model accuracy and fit. The Ridge model showcased promising results, demonstrating its proficiency in predicting English proficiency scores. To ensure the model’s robustness, we validated its performance on a separate test dataset, affirming its effectiveness in predicting English proficiency scores. The final model, with an optimized alpha value of 1.546, yielded a test RMSE of 0.053178, suggesting a % average prediction error.
EDA#
Types of Columns#
Our EDA is not included in this report but the script can be found under src/scripts/english_score_eda.py. Note that the EDA script was used to output the correlation matrix as shown below (Fig. 4) and additional figures used to inform our EDA output can be found under results/figures/ (education-level-fig.png, feat-categoric-figs.png, feat-numeric-figs.png).
Columns that can safely be dropped after looking at the distributions and looking at the data dictionary:
Elogit: is the exponential log of thecorrectcolumn (since we would like to predict thecorrectscore itself as our target, we can omit this tranfromatoin of the target variable from our analysis);Dyslexia: EDA shows that all participants in the training set were not dyslexic hence there will not be any features that the model can learn and will be omitted since all values are 0;Dictionary: as withDyslexia, since none of the participants in the training set used a dictionary, we can safely omit this from our dataset;Natlangs: the native langugages column has a corresponding binary column which is called nat_Eng, which is a yes no column instead of the specific languages the native speakers speak. Therefore, we chose to omit this and go with the simple binary feature since we are interested in the English speaking ability and whether a participant had prior experience/nativity;Primelangs: as withNatlangscolumn, we will opt for the binary column representation in the dataset;Already_participated: all values in the training set are 0 hence can be safely dropped and this feature is not of interest;gender: dropped in order to avoid gender bias;type: this feature represents the original country where the person is from. This information is indirectly captured in the native or primary column and since we care whether the participant is from mainly English speaking vs non-English speaking we will exclude specific countries by type but keep the country column;UK_region,US_region: we remove the region specific information to limit the research in terms of caring whether the participant spent years in an english speaking country regardless of which country it was. We will not consider whether a person lived in ireland or UK as long as it is english speaking so we will use columns likeEng_yearsas opposed toUK_regionorUS_region;currcountry: this column represents the current country the participant lives in. To limit the study and reduce dimensionality we will exclude this column (since we have other features that capture the time spent by a participant in English Speaking countries which we are more interested in). For example a native speaker who currently lives in South Africa still speaks english very well and we capture those details about them byEng_yearsas opposed to where the person currently lives;ebonics: was excluded for the Milestone analysis due to having additional nuances that would need to be handled;time: since we are interested in how students perform, we do not need to consider at what time or date they took their tests. Hence, we will drop the first 4 columns of the dataset;Other additional columns like
id,unnamed:0,q_1, etc.:These columns do not provide meaning in the context of our analysis and will not be used whatsoever in our dataset. We are choosing to drop those columns early on before we visualise our data and examine it for the modelling phase that will follow.
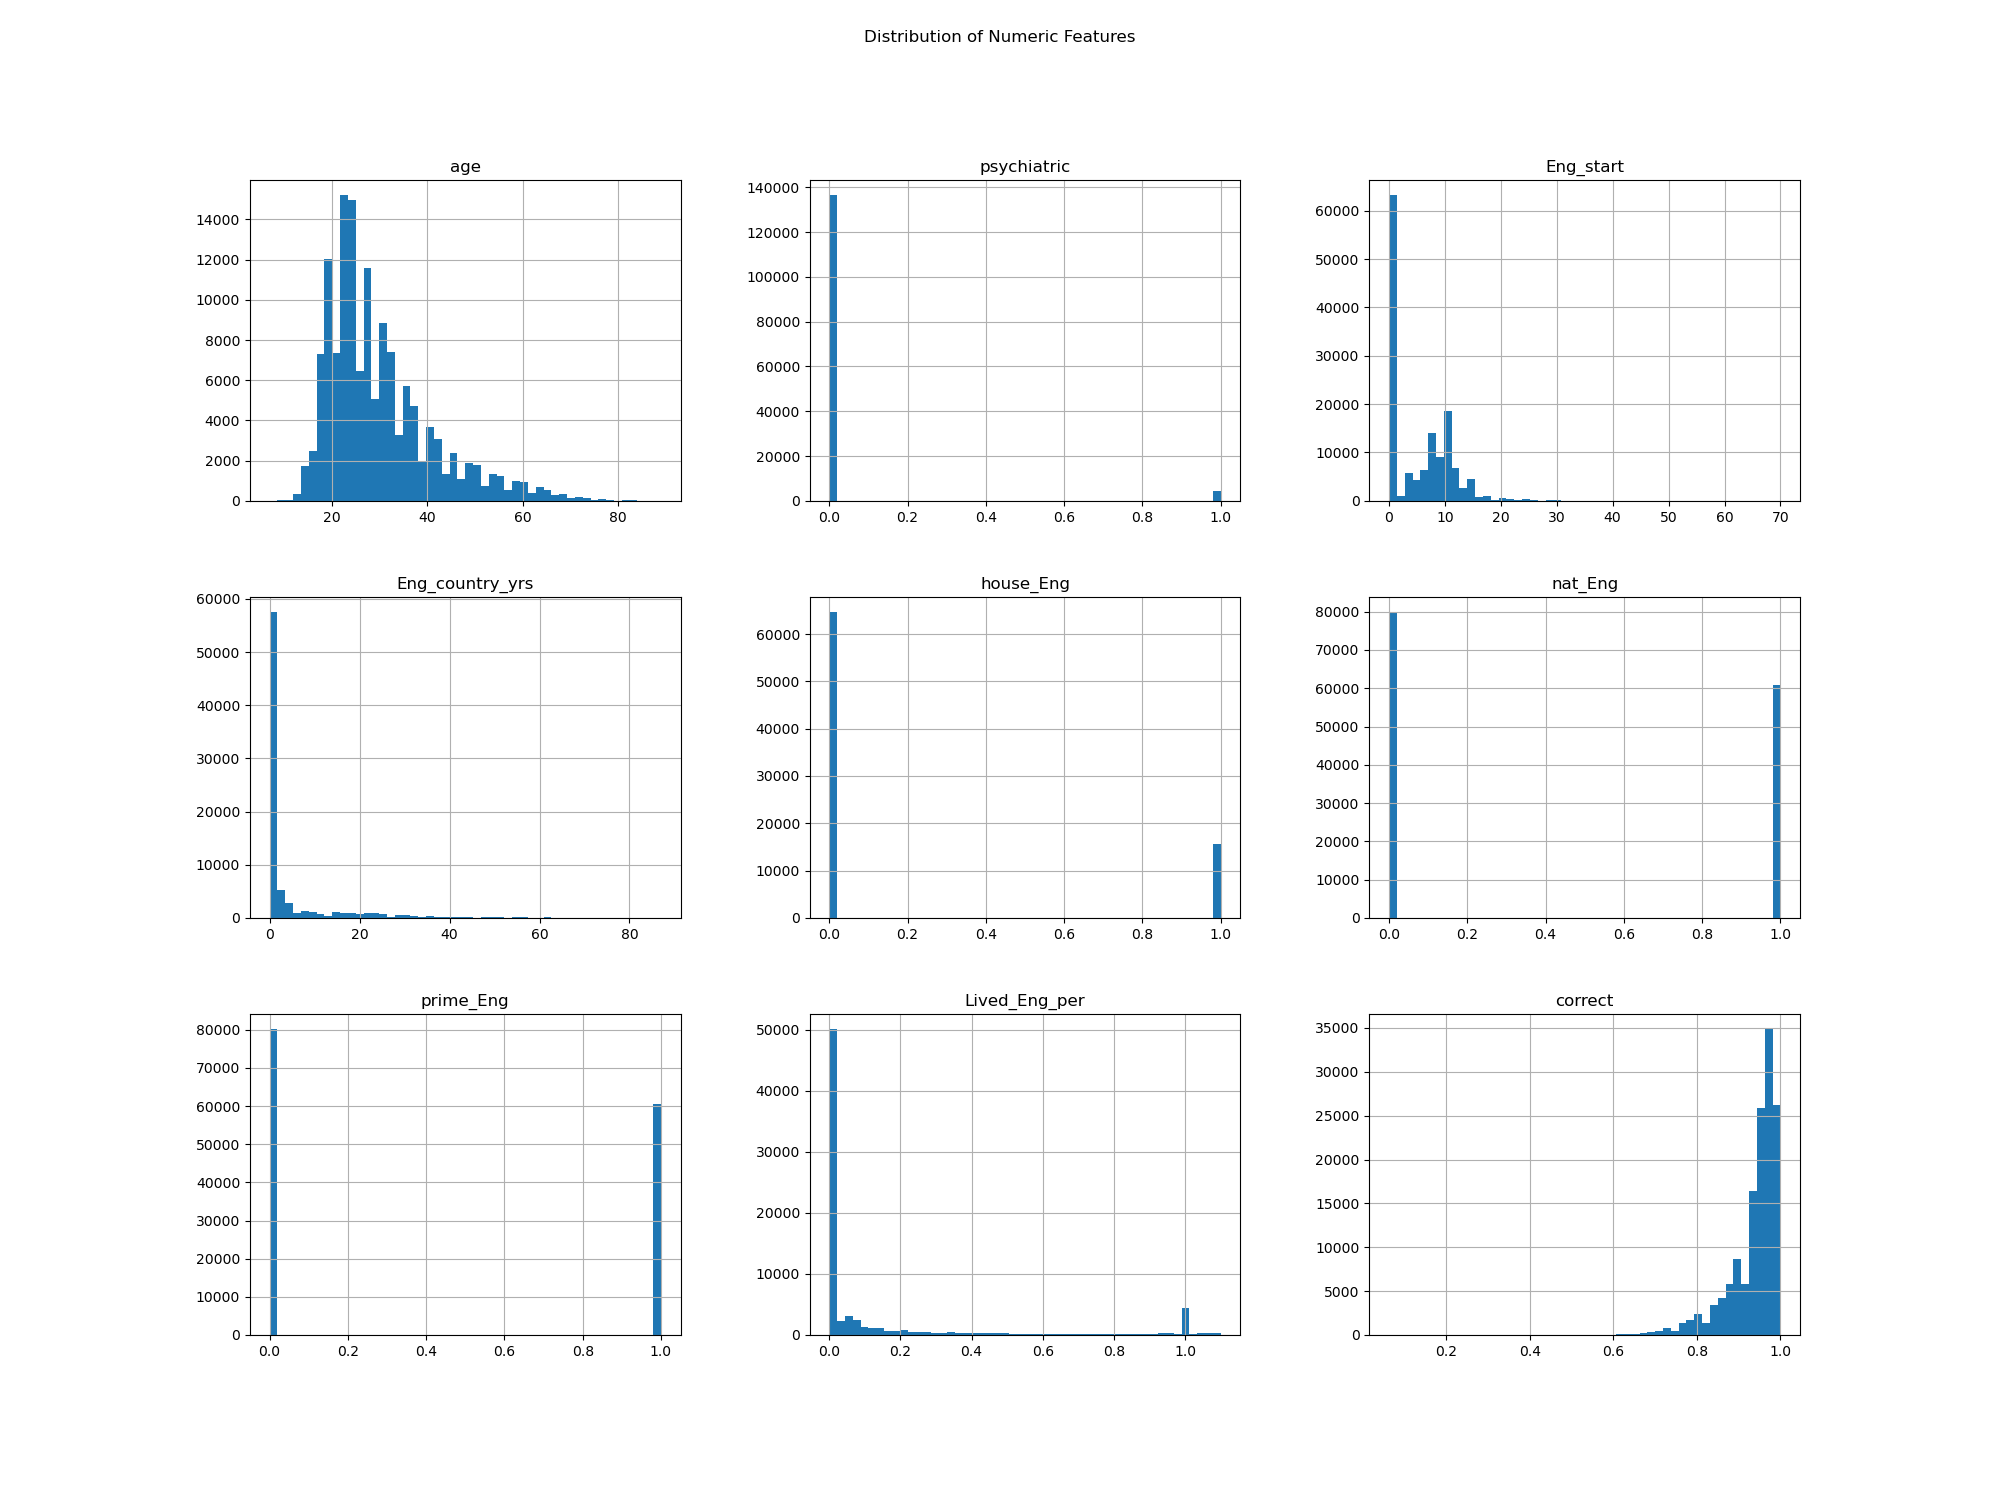
Fig. 1 Numeric Looking Features Distribution#
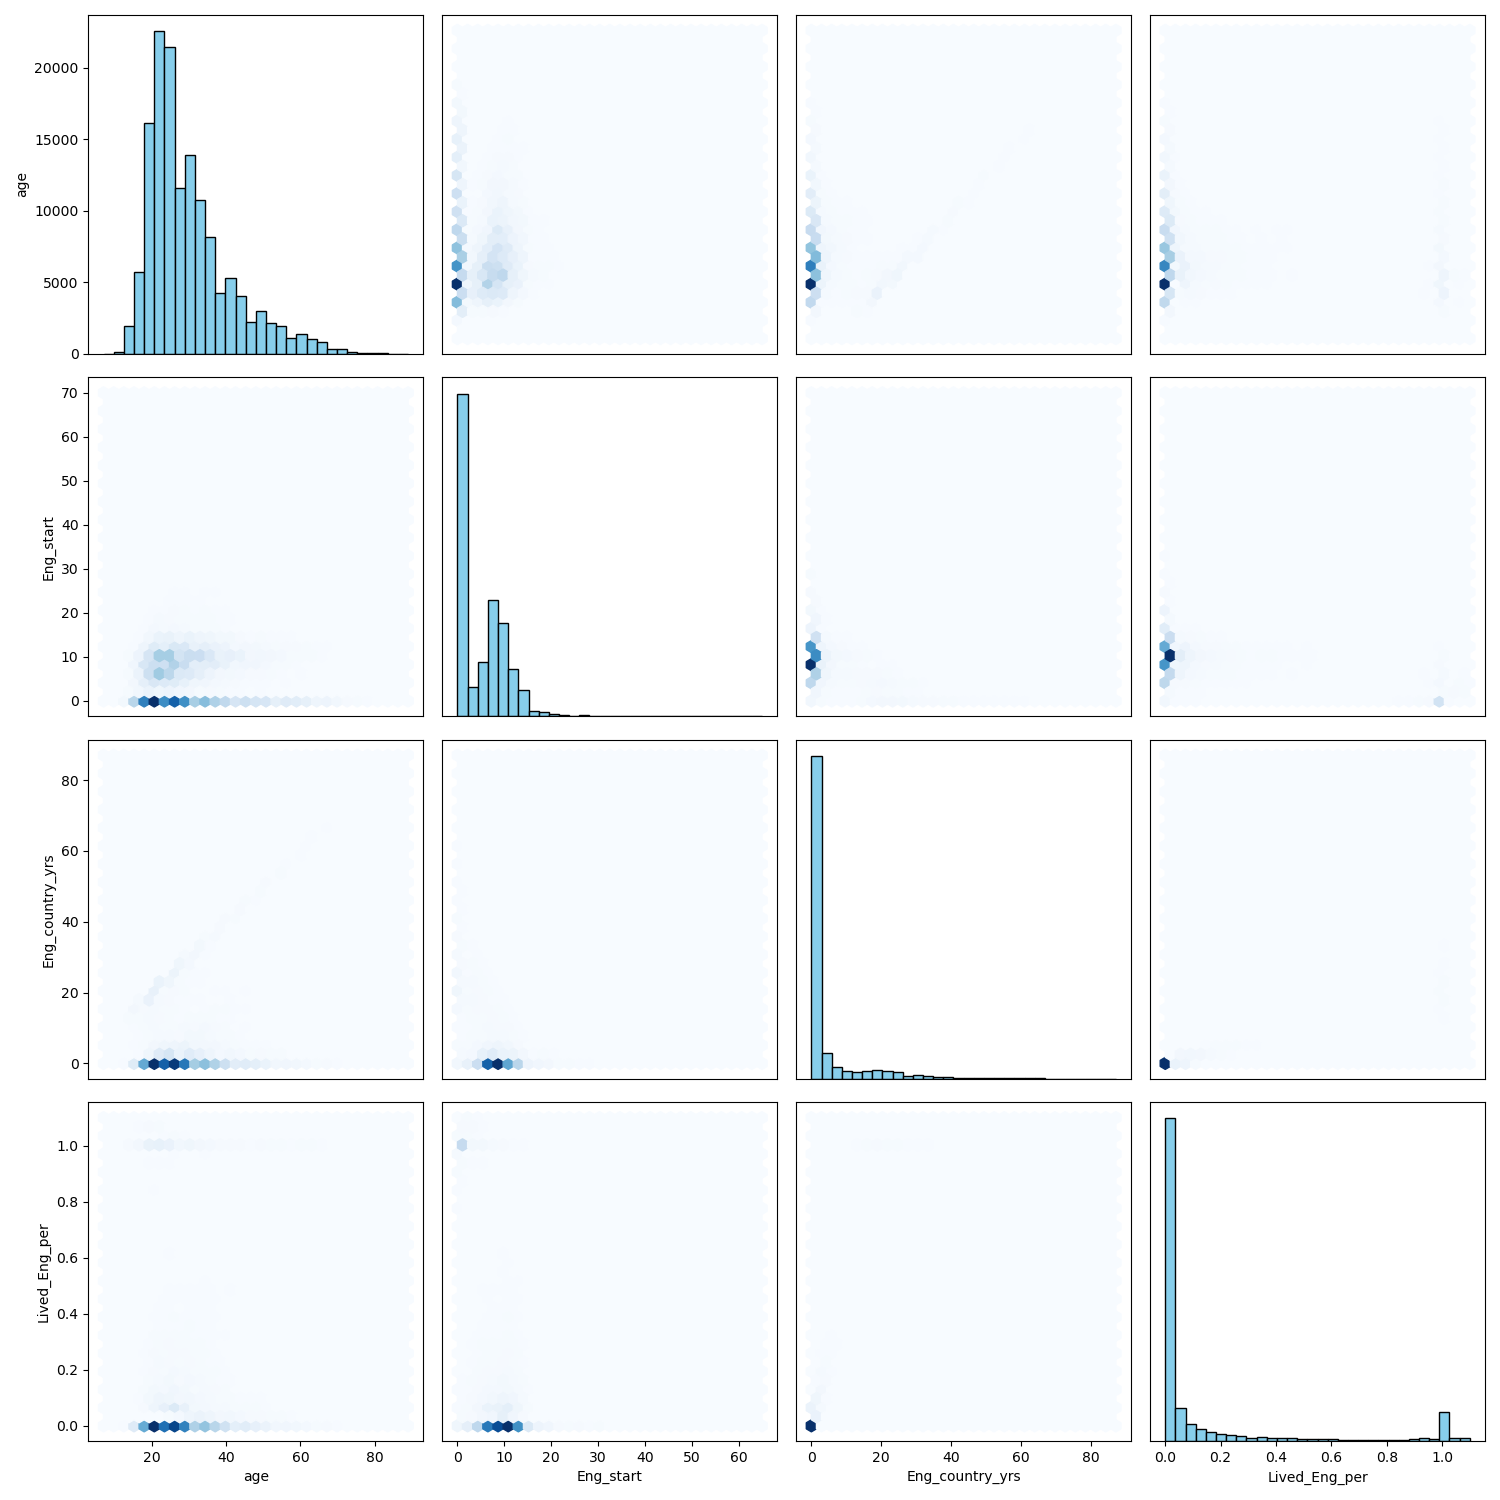
Fig. 2 2D Histogram Pairwise Correlation Plot for Numeric Features#
These were the identified main numeric feature columns:
age: The age of participants ranges from 7 to 89, with a mean of approximately 30.Eng_start: English language proficiency at the start, with values ranging from 0 to 70.Eng_country_yrs: Number of years spent in an English-speaking country, with a mean of 4.44 years.Lived_Eng_per: Percentage of life spent in an English-speaking country, with a mean of 0.15.The
targetcolumn is left-skewed this may be an issue for the model as it is not following the normality assumption; consider to transform the target in future improvements.
Also note that EDA on the training data revealed that the majority of the education levels are the 7 large categories. Therefore, all additional education levels in the other categories which have a value of 1 will be labelled as “Others” to avoid adding major dimensionality to our dataset and we will focus the major education level groupings.
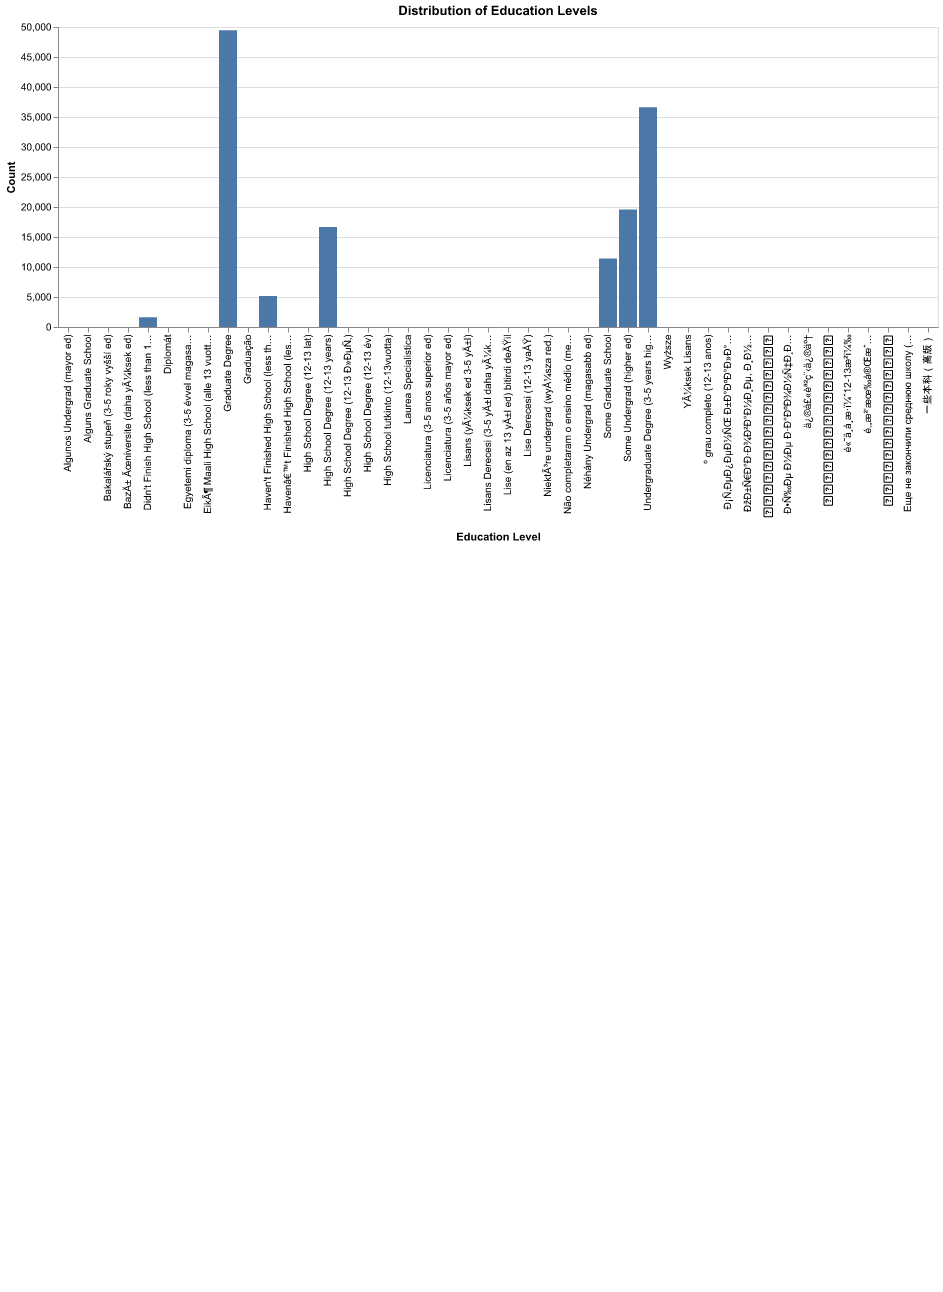
Fig. 3 Education Level Category distribution#
Correlation matrix#
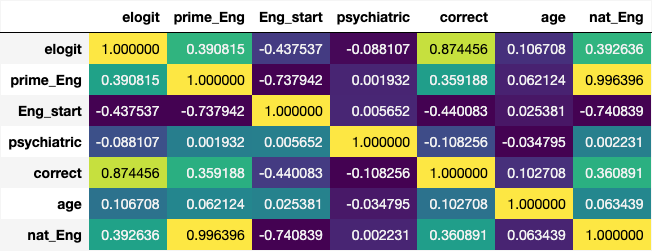
Fig. 4 Correlation matrix for columns not dropped as mentioned above.#
There are strong negative correlations between English language-related variables Eng_start, Eng_country_yrs, Lived_Eng_per,house_Eng,nat_Eng,prime_Eng.
correct(our target) has a moderate positive correlation (0.103) with age indicating a slight positive relationship. However, this correlation is relatively weak. Additionally, correct has a strong negative correlation (-0.440) with Eng_start. This suggests that as the English proficiency at the start decreases, the likelihood of correctness increases.
It’s important to note that correlation does not imply causation.
Modeling & Results#
As discussed in the Methods summary, we will now build and test our Ridge Regression and Lasso Models.
Ridge Regression Model#
In this section we will be using the Ridge Regression model to predict the English Proficiency Score of a participant based on the features we have selected in the previous section.
Ridge regression is a linear regression model that uses L2 regularization [van Wieringen, 2023]. This means that the model penalizes the sum of squared coefficients [Singh, 2019].
We will use the RMSE for our metric of choice to evaluate the performance of our model. This is because it would give us the same units as our target variable and would be easier to interpret. We considered using MAPE as well but since we have some values that are 0 in our target variable, we would have to drop those values and we would lose some information. We also included the R squared (the score that sklearn uses by default when you call score) in our CV results to have another, maybe more intuitive, way of assessing our model performance. Note that we set refit='RMSE' so that our best model that is returned has an alpha value that has the best cross-validated RMSE score.
The cell below shows the top 5 alpha values and their corresponding scores (Fig. 5).
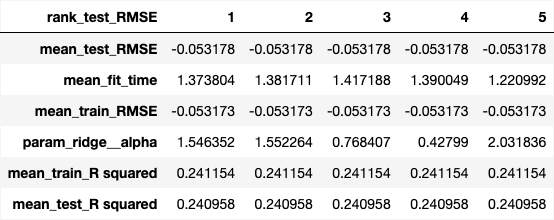
Fig. 5 Results of hyperparameter tuning showing cross-validation results for the top five alpha values in our Ridge model#
We find out that the optimal alpha value for ridge is 1.546352. This corresponds to a CV RMSE of 0.053178 - maximizing the \(R^2\) CV score to 0.240958.
Lasso Regression Model#
The next model that we created is a Lasso Regression model. Lasso stands for Least Absolute Shrinkage and Selection Operator and differs from Ridge Regression in that Lasso allows for feature reduction (i.e. the coefficients can be zero whereas Ridge never sets the coefficient to be zero) [Li and M., 2023]. Like Ridge, Lasso is a linear regression model, but uses L1 regularization - penalizing the sum of the absolute values of the coefficients. Similar to the Ridge Regression modeling above, we performed 10-fold cross-validation using RMSE as our primary scoring metric.
Below are the results of our randomized hyperparameter search for the top 5 alpha values ({numref}lasso_top_models-fig).
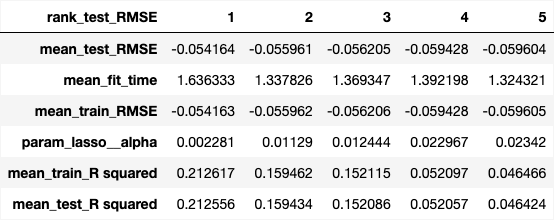
Fig. 6 Results of hyperparameter tuning showing cross-validation results for the top five alpha values in our Lasso model#
For our optimal model with an alpha value of 0.002281, we got a CV RMSE of 0.054164. Like Ridge, we note again that this alpha value is optimal for both RMSE and \(R^2\) - maximizing the \(R^2\) CV score to 0.212556.
Model Selection#
The CV RMSE and test score results from the Ridge and Lasso models detailed above are very similar, however the optimal Ridge model performs marginally better (with roughly a 5.31779880575363% RMSE on the training data). Then, scoring the optimal Ridge model on our test data, we get an R-squared score of 0.2424 and an RMSE of 0.0528. We also see that the model is not overfitting since the CV and test scores are very close to each other (both rounding to 24.242787%). Therefore, our optimal model is the Ridge linear model trained with L2 regularization and an alpha value of 1.546352.
Discussion#
Coefficient Interpretation#
Looking at our optimal model, we are able to look at the learned coefficients for the model features. We interpret our results in that increasing features with positive coefficients is associated with an increased correct test score, whereas an increase in the features with negative coefficients is associated with decreasing correct test scores.
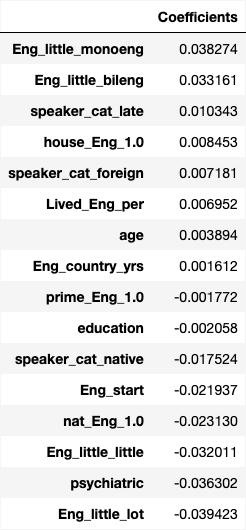
Fig. 7 Learned feature coefficients from fitting optimal Ridge model on training data.#
From the results above (Fig. 7), we can see that the most important features in determining a high English Proficiency Score are:
Eng_little_monoeng: This is a binary column that indicates whether the participant is a native speaker of English or not. This is the most important feature associated with increasing the English Proficiency Score.Eng_little_bileng: This is a binary column that indicates whether the participant is native speaker of English plus at least one other language. This is the second most important feature associated with increasing the English Proficiency Score.
This shows that the most important feature in increasing the English Proficiency Score among this dataset is whether the participant is a native speaker of English or not. This is followed by whether the participant is a native speaker in both English and at least one other language - both of which make sense logically.
The most important features in lowering the English Proficiency Score are:
Eng_little_lot: This is a binary column that indicates whether the participant is an immersion learner.psychiatric: This is a binary column that indicates whether the participant has any psychiatric disorders.Eng_little_little: This is a binary column that indicates whether the participant is a non-immersion learner.
This somewhat makes sense since the most important features in determining the test scores is the Eng_little encoding. If the person is a native speaker or a native speaker of English and at least one other language, they would have a higher test score. If the person is an immersion learner or a non-immersion learner, they would have a lower test score.
Model Performance#
We measured the performance of our model on the test data with our RMSE test score of 0.0528 (a test MSE of 0.0028), as well as a MAPE of 0.0425. Our model performed well on the test data - which we can further visualize by plotting our predicted test English Proficiency Score values against our actual test English Proficiency Score values. From these numbers, we can make a couple general notes on our model performance. Our \(R^2\) value of 0.2424 means that 24.24% of the variance in the correct English Proficiency Score is associated with the features (as illustrated in our coefficient table above) in our model. Additionally, our RMSE of 0.0528 suggests that, on average, our predictions have an error of 5.28%. We can further visualize the performance of our model by plotting our predicted test English Proficiency Score values against our actual test English Proficiency Score values - we do so in Fig. 8 below, plotting a 2D-histogram.
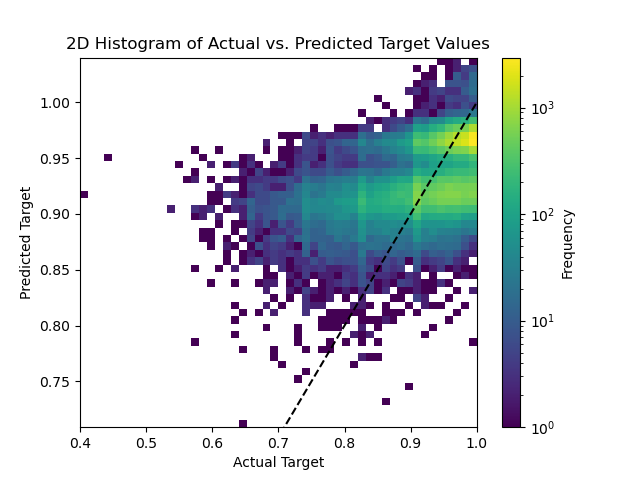
Fig. 8 2D-histogram showing the actual English Proficiency Scores vs. the predicted English profciency scores using our optimal model.#
The scatterplot above (Fig. 8) plots our predicted English Proficiency Scores from our Ridge model against the actual English Proficiency Scores. The dashed black line represents the “perfect” prediction where the predicted is equal to the actual score. We see that the majority of the examples are clustered in the English Proficiency Score range of 80-100. We see that, as we increase the predicted scores, our residuals tend to cluster more around our “perfect” dashed line. However, we can note from the plot above that our model appears to better predict higher English Proficiency Scores - varying significantly from the actual score for lower English Proficiency Scores.
Limitations and Next Steps#
Considering the limitations noted above, our model may be useful in the initial analysis of individuals wanting to learn English as a second language to make an informal prediction on an estimated level of English Proficiency. This estimated English Proficiency Score could be used as a tool to allocate the appropriate amount of resources or suggest a certain level of guidance to an individual to best facilitate their English learning. This work could be further explored with a more in depth look at the feature importance and the correlation between specific features in the dataset and how they are associated with test scores. This could also be improved with feature selection to see which combination of features would be best used to help the model better predict test scores. Additionally, other regression models could be explored, such as KNN regression, to see if allowing for non-linear decision boundaries
References#
- EW15
Nick C. Ellis and Stefanie Wulff. Second language acquisition. In Ewa Dąbrowska and Dagmar Divjak, editors, The Handbook of Cognitive Linguistics, pages 409–431. DeGruyter Mouton, 2015.
- Har20
J. Hartshorne. Data: a critical period for second language acquisition: evidence from 2/3 million english speakers. https://osf.io/pyb8s/wiki/home/, September 2020. Dataset.
- HTP18
J. K. Hartshorne, J. B. Tenenbaum, and S. Pinker. A critical period for second language acquisition: evidence from 2/3 million english speakers. Cognition, 177:263–277, 2018. doi:10.1016/j.cognition.2018.04.007.
- LM23
H. L. Li and M. Practitioner’s guide to data science. 10.2 lasso. https://scientistcafe.com/ids/lasso, April 2023.
- Sin19
Deepika Singh. Linear, lasso, and ridge regression with r. https://www.pluralsight.com/guides/linear-lasso-and-ridge-regression-with-r, November 2019.
- vW23
Wessel N. van Wieringen. Lecture notes on ridge regression. https://arxiv.org/pdf/1509.09169.pdf, June 2023.