Predicting high-potential FIFA players using individual performance data#
Merete Lutz, Jake Barnabe, Simon Frew, Waleed Mahmood
DSCI 522, Group 17
Summary#
We attempt to construct a classification model using an RBF SVM classifier algorithm which uses FIFA22 player attribute ratings to classify players’ potential with target classes “Low”, “Medium”, “Good”, and “Great”. The classes are split on the quartiles of the distribution of the FIFA22 potential ratings. Our model performed reasonably well on the test data with an accuracy score of 0.809, with hyperparamters C: 100.0 & Gamma: 0.010. However, we believe there is still significant room for improvement before the model is ready to be utilized by soccer clubs and coaching staffs to predict the potential of players on the field instead of on the screen.
Introduction#
One of the most challenging jobs for sports coaches is deciding which players will make a positive addition to the team [USNSTPA, n.d.]. A key step in evaluating which players to add to a team is predicting how their skill level will change over time. We can think of this in terms of their potential. FIFA22 by EA sports is the world’s leading soccer video game. For each year’s release, they rate players’ skill levels in various aspects of the game such as shooting, passing, defending, etc. and give each player an overall rating as well as a rating of each player’s potential.
Here we ask if we can use a machine learning model to classify players by their potential given their attribute ratings. We have binned the continuous potential variable into four classes for the purpose of evaluating player talent as “Low”, “Medium”, “Good”, and “Great”. Answering this question is important as developing a model that can accurately predict the potential of players on FIFA22 could then be applied to the evaluation of soccer players in real life and be employed by coaches and scouts to help soccer clubs make good decisions on which players to add to the team and which to let go.
Methods#
Data#
The data used in this analysis are from the video game FIFA22 by EA Sports. The data were downloaded with authentication from Kaggle and without authentication from Sports-Statistics.com. Within documentation, these were were scraped from a publicly available website (https://sofifa.com/) with a permissive robots.txt.
Each row of the dataset corresponds to a single player, and contains biometric information, ratings for various skills, like shooting accuracy, passing, dribbling, and player wages and market value.
Analysis#
The Radial Basis Function (RBF) Support Vector Machine (SVM) RBF SVM model was used to build a classification model to predict whether a player has high potential or not (found in the potential column of the data set). The variables included in our model were selected from the list of different player statistics that are part of the dataset, including the statistics on their speed, dribbling, shooting etc. These are the variables that were used as features to fit the model. The hyperparameters gamma and C were chosen through the use of the automated optimization method from scikit-learn called RandomizedSearchCV. The Python programming language [Van Rossum and Drake, 2009] was used and the following Python packages were used to perform the analysis: Numpy [Harris et al., 2020], Pandas [McKinney and others, 2010], altair [VanderPlas et al., 2018], SkLearn [Pedregosa et al., 2011] and SciPy [Virtanen et al., 2020]. The code used to perform the analysis and create this report can be found here: UBC-MDS/2023_dsci522-group17.
Results and Discussion#
To look at whether each of the predictors might be useful to predict the class of the target variable potential, we plotted the distributions of each predictor from the training data set and coloured the distribution by class (Low: blue, medium: orange, Good: red, Great: green). These distributions are drawn up after we have scaled all of the features in the training dataset. In doing this, we can see that most of the distributions, for the features we have filtered to keep, have overlap but their spreads and centers are different, except for height_cm and weight_kg - which overlap almost completely across the different classes of potential - and value_eur - which has no distribution for classes other than great for potential. We chose to not omit these features from our model as they could still prove informative through interactions.
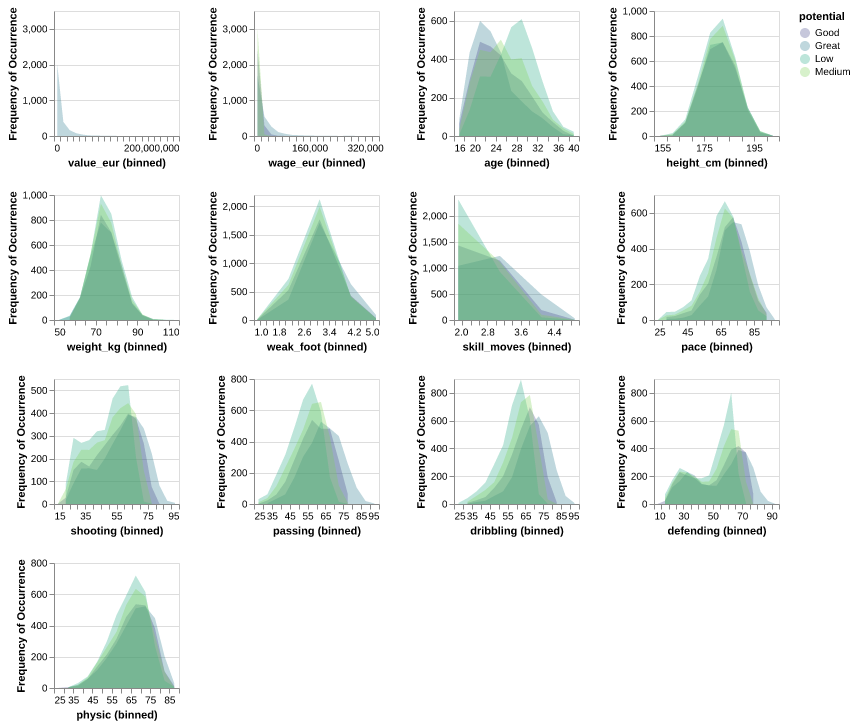
Fig. 1 Comparison of the distributions of numeric predictors in the training set between the 4 levels of potential.#
Through our model selection process, we were able to determine that the best model in our case would be an RBF SVM model. To determine the values for the hyperparameters that would give us the best estimator, we used the hyperparameter optimization method RandomizedSearchCV to perform a 5-fold cross validation, so that we are able to get the most suitable hyperparamters to obtain the best possible model to estimate and predict the class for potential.
| dummy | Decision Tree | KNN | RBF SVM | Naive Bayes | Logistic Regression | |
|---|---|---|---|---|---|---|
| fit_time | 0.004 (+/- 0.001) | 0.053 (+/- 0.005) | 0.024 (+/- 0.004) | 2.859 (+/- 0.034) | 0.012 (+/- 0.002) | 0.237 (+/- 0.022) |
| score_time | 0.002 (+/- 0.000) | 0.003 (+/- 0.001) | 0.344 (+/- 0.010) | 0.876 (+/- 0.041) | 0.003 (+/- 0.001) | 0.007 (+/- 0.000) |
| test_score | 0.276 (+/- 0.000) | 0.821 (+/- 0.006) | 0.567 (+/- 0.005) | 0.751 (+/- 0.009) | 0.570 (+/- 0.007) | 0.705 (+/- 0.005) |
| train_score | 0.276 (+/- 0.000) | 1.000 (+/- 0.000) | 0.728 (+/- 0.004) | 0.786 (+/- 0.002) | 0.570 (+/- 0.002) | 0.709 (+/- 0.002) |
Fig. 2 Time to fit and score as well as test and train scores for each model we looked at.#
We observe that the optimal hyperparameter values are C: 100.0 and Gamma: 0.010. The cross-validation accuracy obtained with these hyperparameters is 0.812.
| Mean test score: | Mean train score: | Value of C: | Value of gamma: | Mean fit time: | |
|---|---|---|---|---|---|
| Rank test score | |||||
| 1 | 0.812 | 0.836 | 100 | 0.010 | 6.130 |
| 2 | 0.780 | 0.948 | 100 | 0.100 | 10.778 |
| 3 | 0.778 | 0.876 | 10 | 0.100 | 5.927 |
| 4 | 0.772 | 0.785 | 10 | 0.010 | 5.995 |
| 5 | 0.752 | 0.759 | 100 | 0.001 | 5.728 |
Fig. 3 The top 5 performing models from hyperparameter optimization.#
And the accuracy of our model is 0.809, i.e. it predicted quite well when run on the test data with low overfitting. However, before being implemented by coaches and scouts to evaluate players on the field, there are still some improvements to be made. These are explored in the next section.
| SVC | |
|---|---|
| Test Score | 0.809 |
Fig. 4 The final score of our model on the test data.#
Further Improvements#
To improve our model further in the future, with the hopes of better predicting the potential of a player, there are a few improvements that can be made. First of all, we could include the growth of a player over the years, based on their performance in games. This would somewhat lead to us having a time-series dataset which we can use to create a feature that captures the growth of a player over the years. Second, we would include the effort that the player puts into their training. This can be a beneficial improvement that could lead to better predictive power in our model. Finally, we could include the reporting of the probability estimates of the prediction of the classes in for the potential of a player, so that a player scout knows with how much certainty a player might be classified as a Great player (for example).
References#
- USN
USNSTPA. How to evaluate soccer players. URL: https://ussoccerplayers.com/soccer-training-tips/evaluating-players (visited on 2023-12-03).
- VRD09
Guido Van Rossum and Fred L Drake. Introduction to python 3: python documentation manual part 1. CreateSpace, 2009.
- HMVDW+20
Charles R Harris, K Jarrod Millman, Stéfan J Van Der Walt, Ralf Gommers, Pauli Virtanen, David Cournapeau, Eric Wieser, Julian Taylor, Sebastian Berg, Nathaniel J Smith, and others. Array programming with numpy. Nature, 585(7825):357–362, 2020.
- M+10
Wes McKinney and others. Data structures for statistical computing in python. In Proceedings of the 9th Python in Science Conference, volume 445, 51–56. Austin, TX, 2010.
- VGH+18
Jacob VanderPlas, Brian Granger, Jeffrey Heer, Dominik Moritz, Kanit Wongsuphasawat, Arvind Satyanarayan, Eitan Lees, Ilia Timofeev, Ben Welsh, and Scott Sievert. Altair: interactive statistical visualizations for python. Journal of open source software, 3(32):1057, 2018.
- PVG+11
Fabian Pedregosa, Gaël Varoquaux, Alexandre Gramfort, Vincent Michel, Bertrand Thirion, Olivier Grisel, Mathieu Blondel, Peter Prettenhofer, Ron Weiss, Vincent Dubourg, and others. Scikit-learn: machine learning in python. the Journal of machine Learning research, 12:2825–2830, 2011.
- VGO+20
Pauli Virtanen, Ralf Gommers, Travis E Oliphant, Matt Haberland, Tyler Reddy, David Cournapeau, Evgeni Burovski, Pearu Peterson, Warren Weckesser, Jonathan Bright, and others. Scipy 1.0: fundamental algorithms for scientific computing in python. Nature methods, 17(3):261–272, 2020.