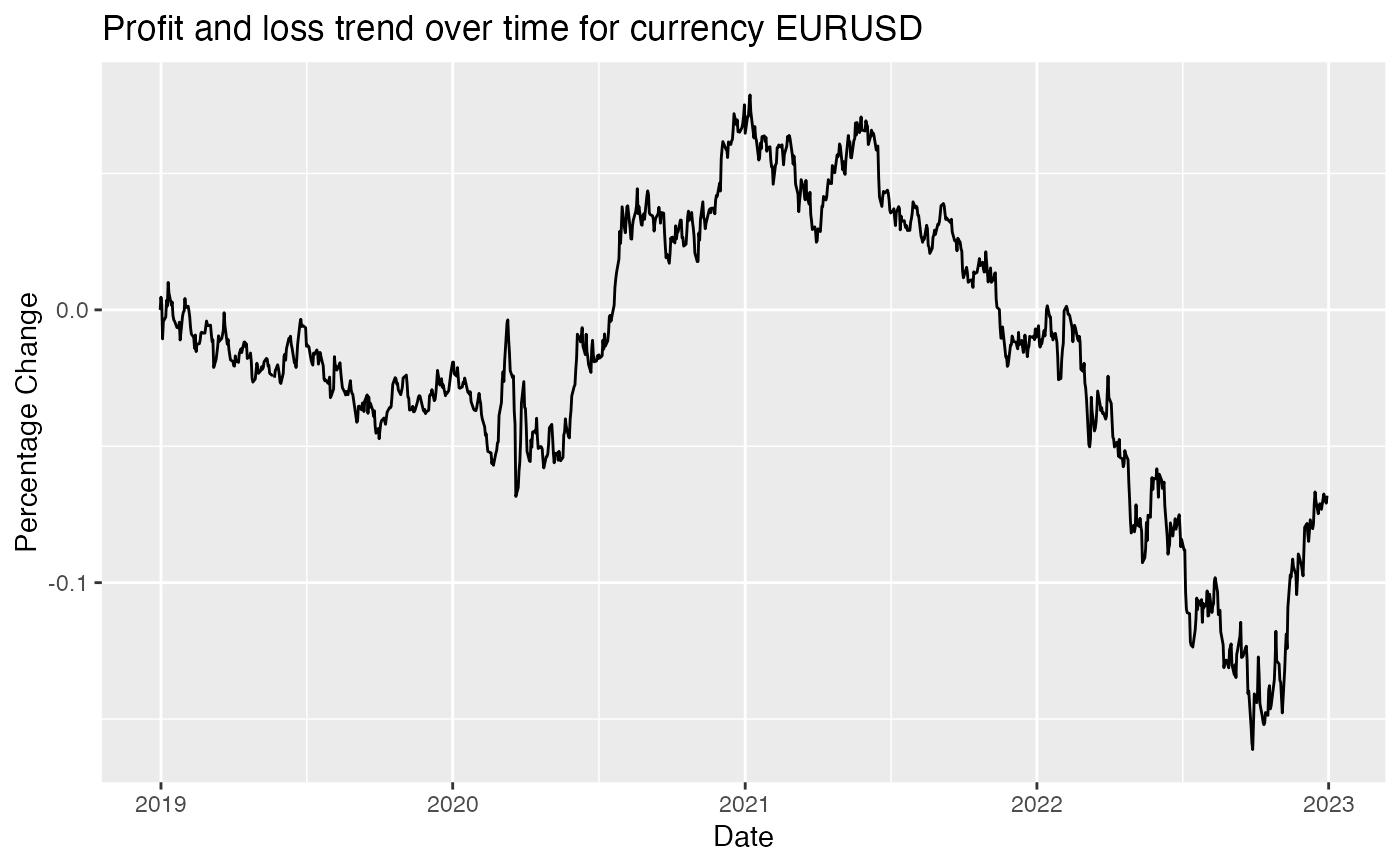
Visualizes trend of the profit and loss of a currency pair between the selected start date and end date.
pl_trend_viz.RdVisualizes trend of the profit and loss of a currency pair between the selected start date and end date.
pl_trend_viz(curr, start_date, end_date, chart_type)Arguments
- curr
A character vector which is the ticker of the currency pair such as 'EURUSD'
- start_date
A character vector that is the start date of the selected period of time
- end_date
A character vector that is the end date of the selected period of time
- chart_type
A character vector that is the type of the chart
Value
A ggplot that shows the trend of the profit and loss of a currency pair over the selected period of time
Examples
pl_trend_viz('EURUSD', '2018-12-31', '2022-12-31', 'line')