Visualizes trend of the exchange rate of a currency pair between the selected start date and end date.
price_trend_viz.RdVisualizes trend of the exchange rate of a currency pair between the selected start date and end date.
price_trend_viz(curr, start_date, end_date, option)Arguments
- curr
A character vector which is the ticker of the currency pair such as 'EURUSD'
- start_date
A character vector which is the start date of the selected period of time
- end_date
A character vector which is the end date of the selected period of time
- option
A character vector which must be from 'open', high', "low', 'close'
Value
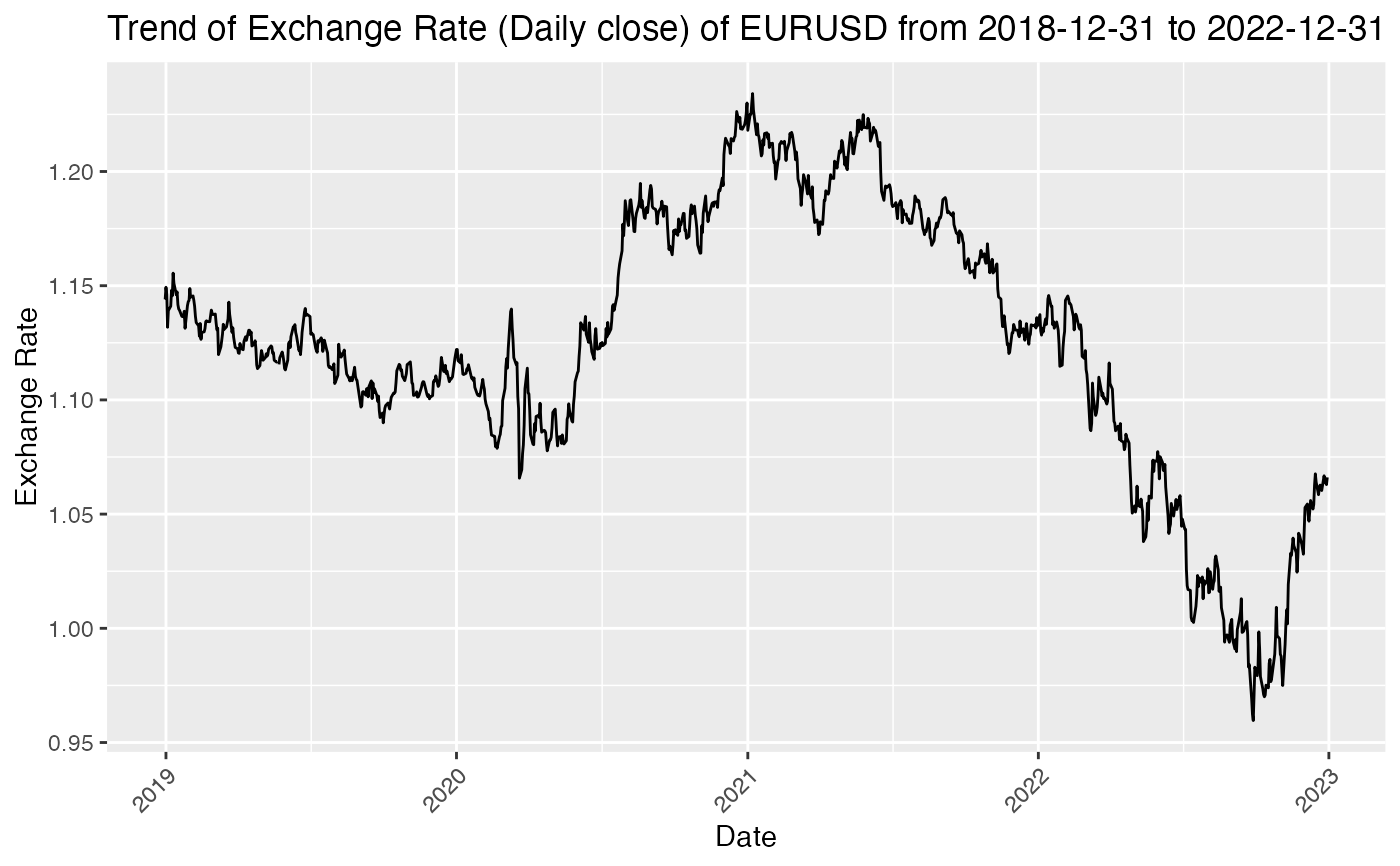
A line plot that shows the trend of the exchange rate of a currency pair over the selected period of time.
Examples
price_trend_viz('EURUSD', '2018-12-31', '2022-12-31', 'close')