classification_df = pd.read_csv("data/quiz2-grade-toy-classification.csv")
classification_df
21 rows × 8 columns
X = classification_df.drop(columns=["quiz2"])
y = classification_df["quiz2"]
X_subset = X[["lab4", "quiz1"]]
X_subset.head()
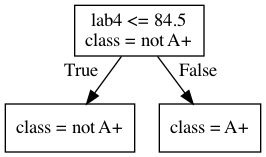
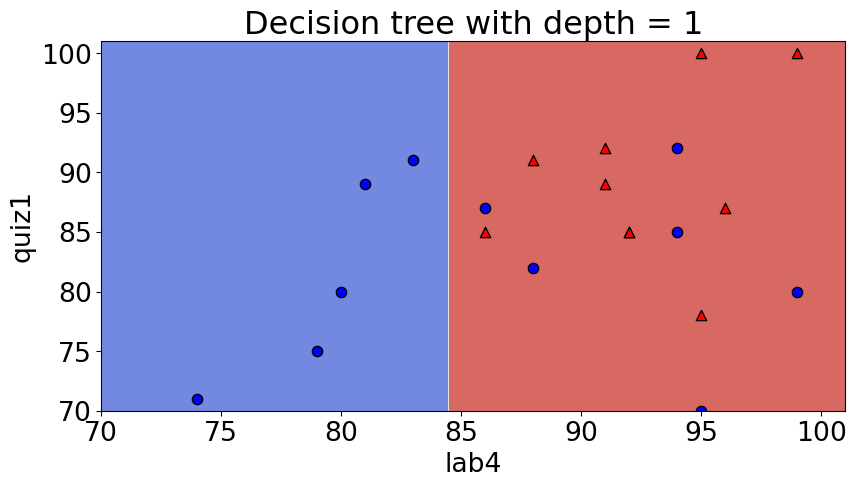
from sklearn.tree import DecisionTreeClassifier

depth = 1
model = DecisionTreeClassifier(max_depth=depth)
model.fit(X_subset, y)
model.score(X_subset, y)
0.7142857142857143
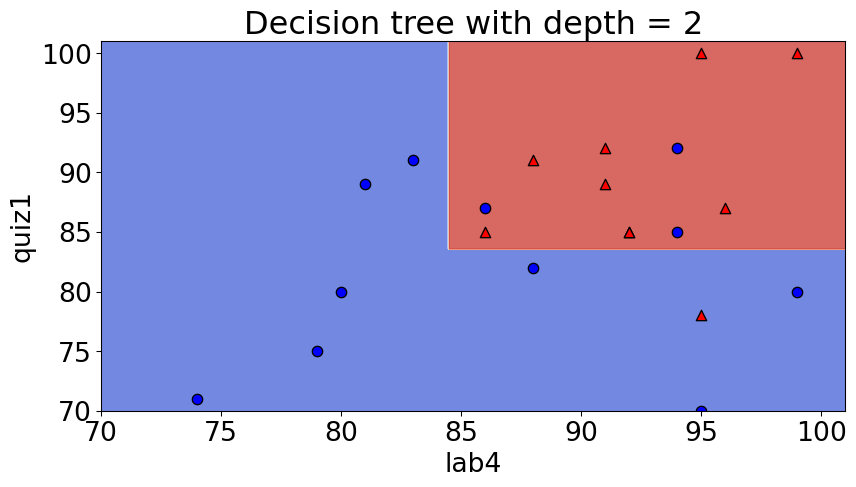
depth = 2
model = DecisionTreeClassifier(max_depth=depth)
model.fit(X_subset, y)
model.score(X_subset, y)
0.8095238095238095
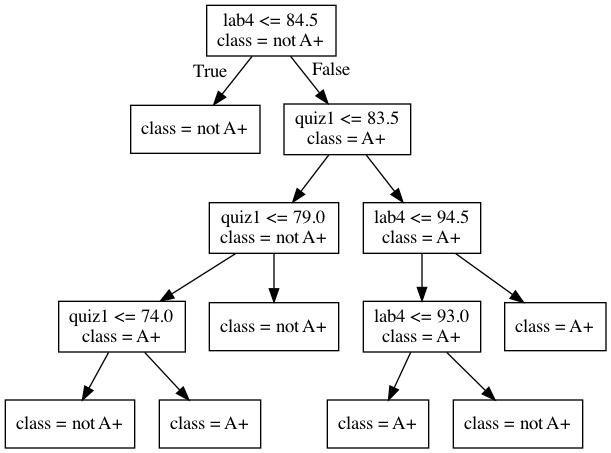
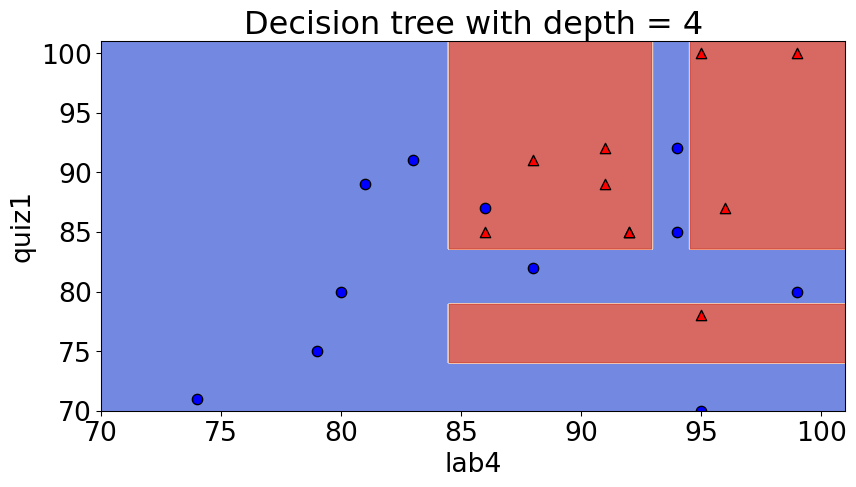
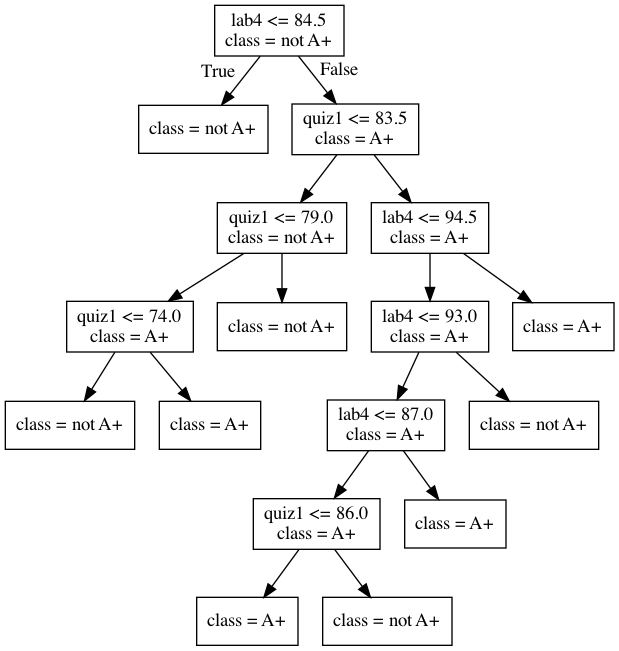
depth = 4
model = DecisionTreeClassifier(max_depth=depth)
model.fit(X_subset, y)
model.score(X_subset, y)
0.9523809523809523
model.score(X_subset, y)
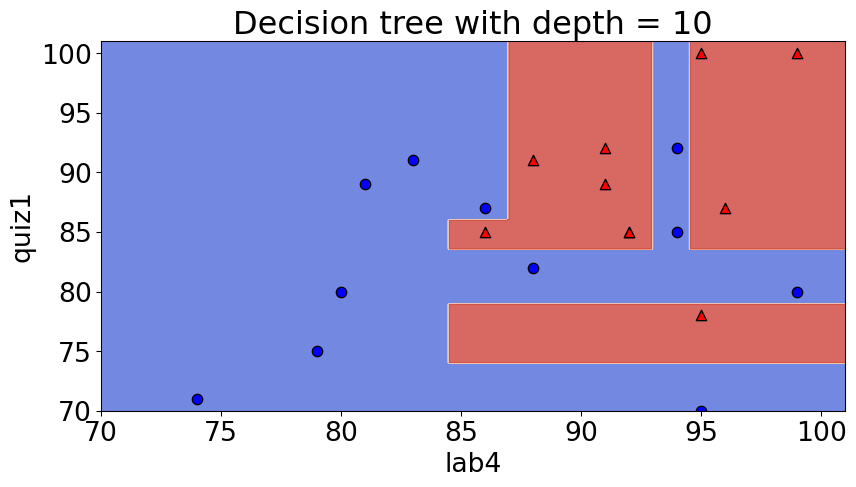
depth = 10
model = DecisionTreeClassifier(max_depth=depth)
model.fit(X_subset, y)
model.score(X_subset, y)
1.0
Given a model in machine learning, people usually talk about two kinds of accuracies (scores):
Accuracy on the training data
Accuracy on the entire distribution of data