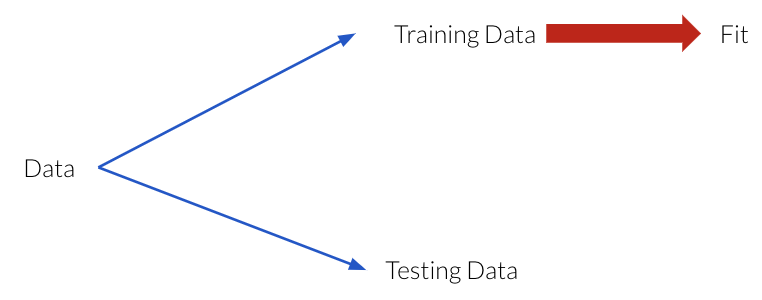
Given a model, in Machine Learning (ML), people usually talk about two kinds of scores (accuracies):
Score on the training data
Score on the entire distribution of data
Attribution
cities_df = pd.read_csv("data/canada_usa_cities.csv")
cities_df
209 rows × 3 columns
X = cities_df.drop(columns=["country"])
X
209 rows × 2 columns
y = cities_df["country"]
y
0         USA
1         USA
2         USA
        ...
206    Canada
207    Canada
208    Canada
Name: country, Length: 209, dtype: object
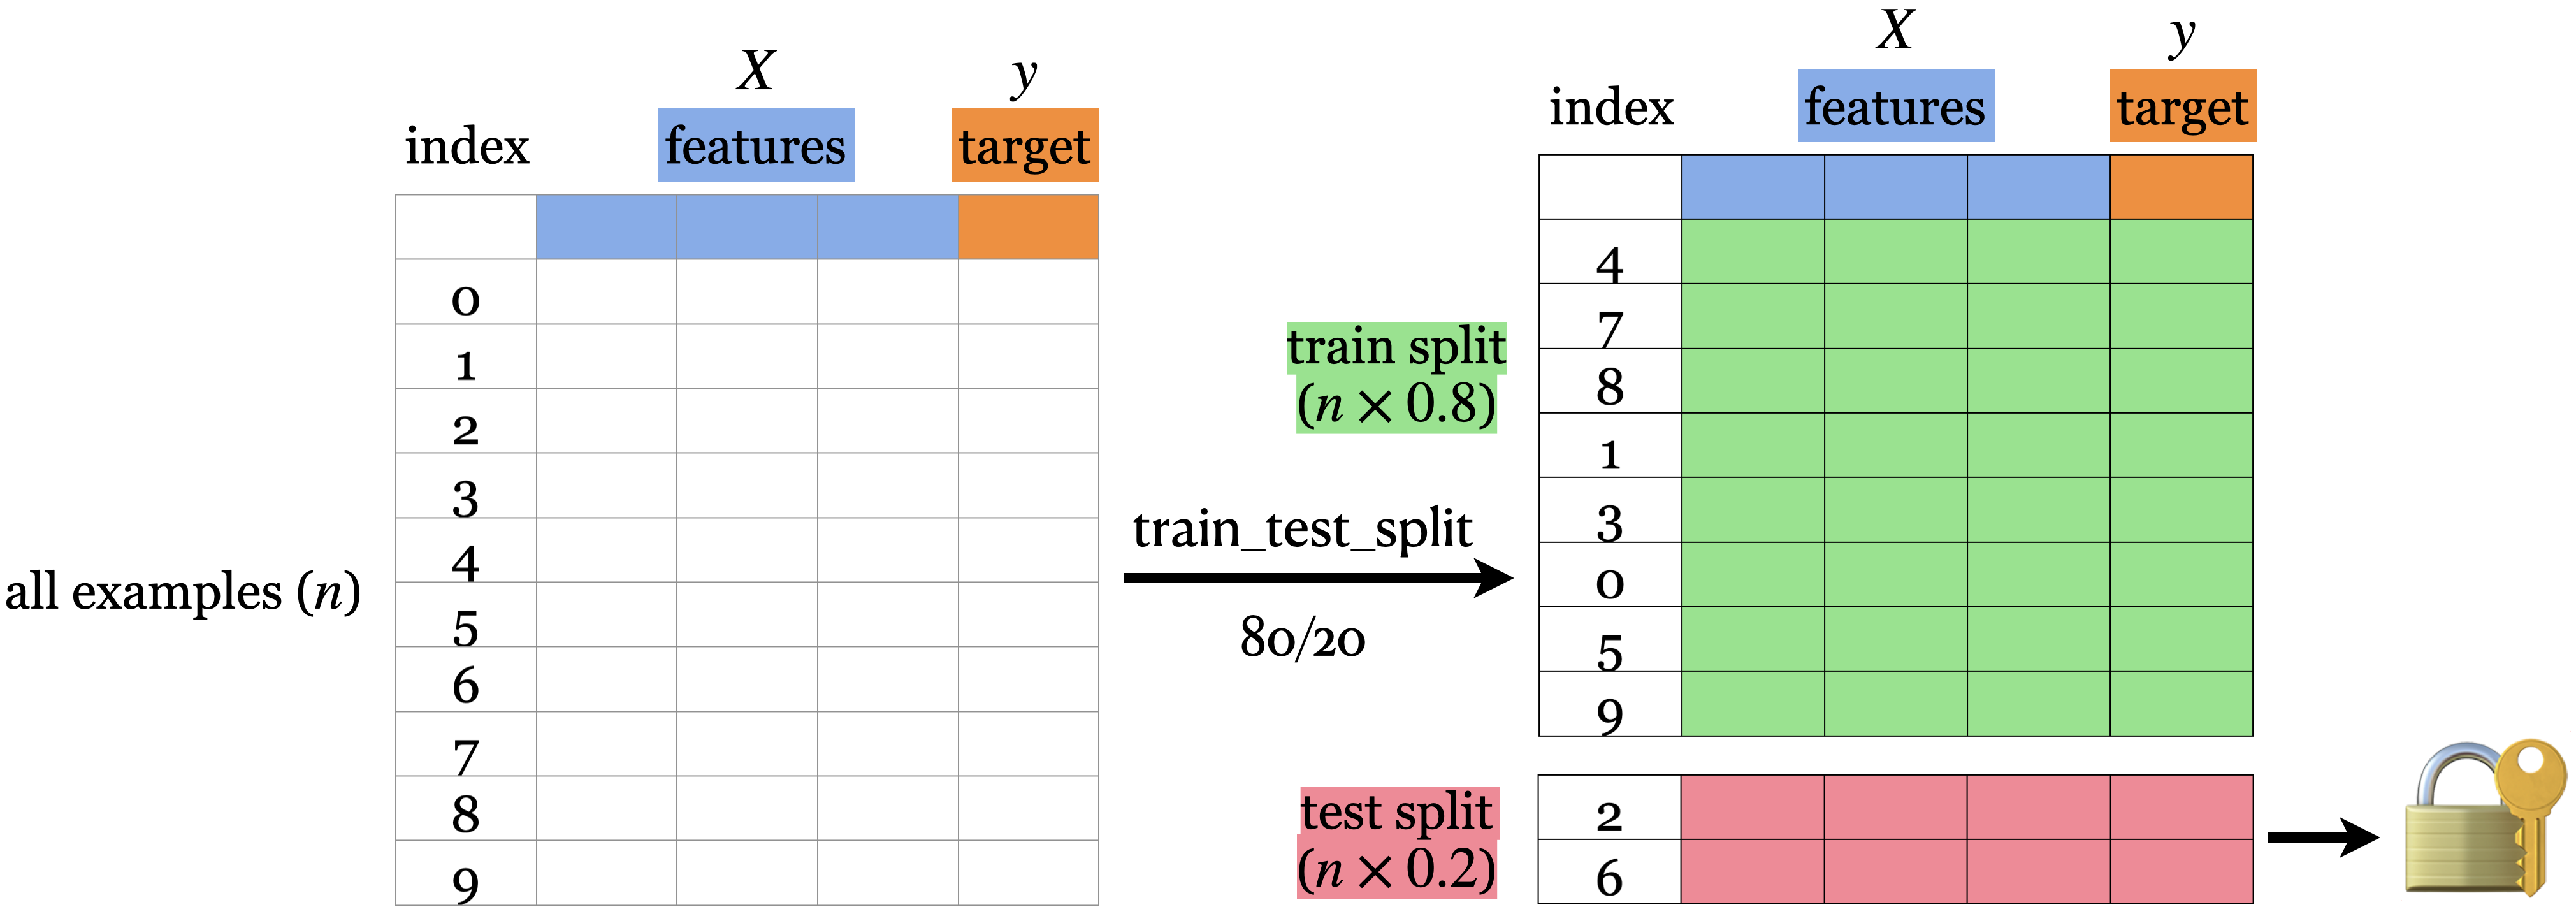
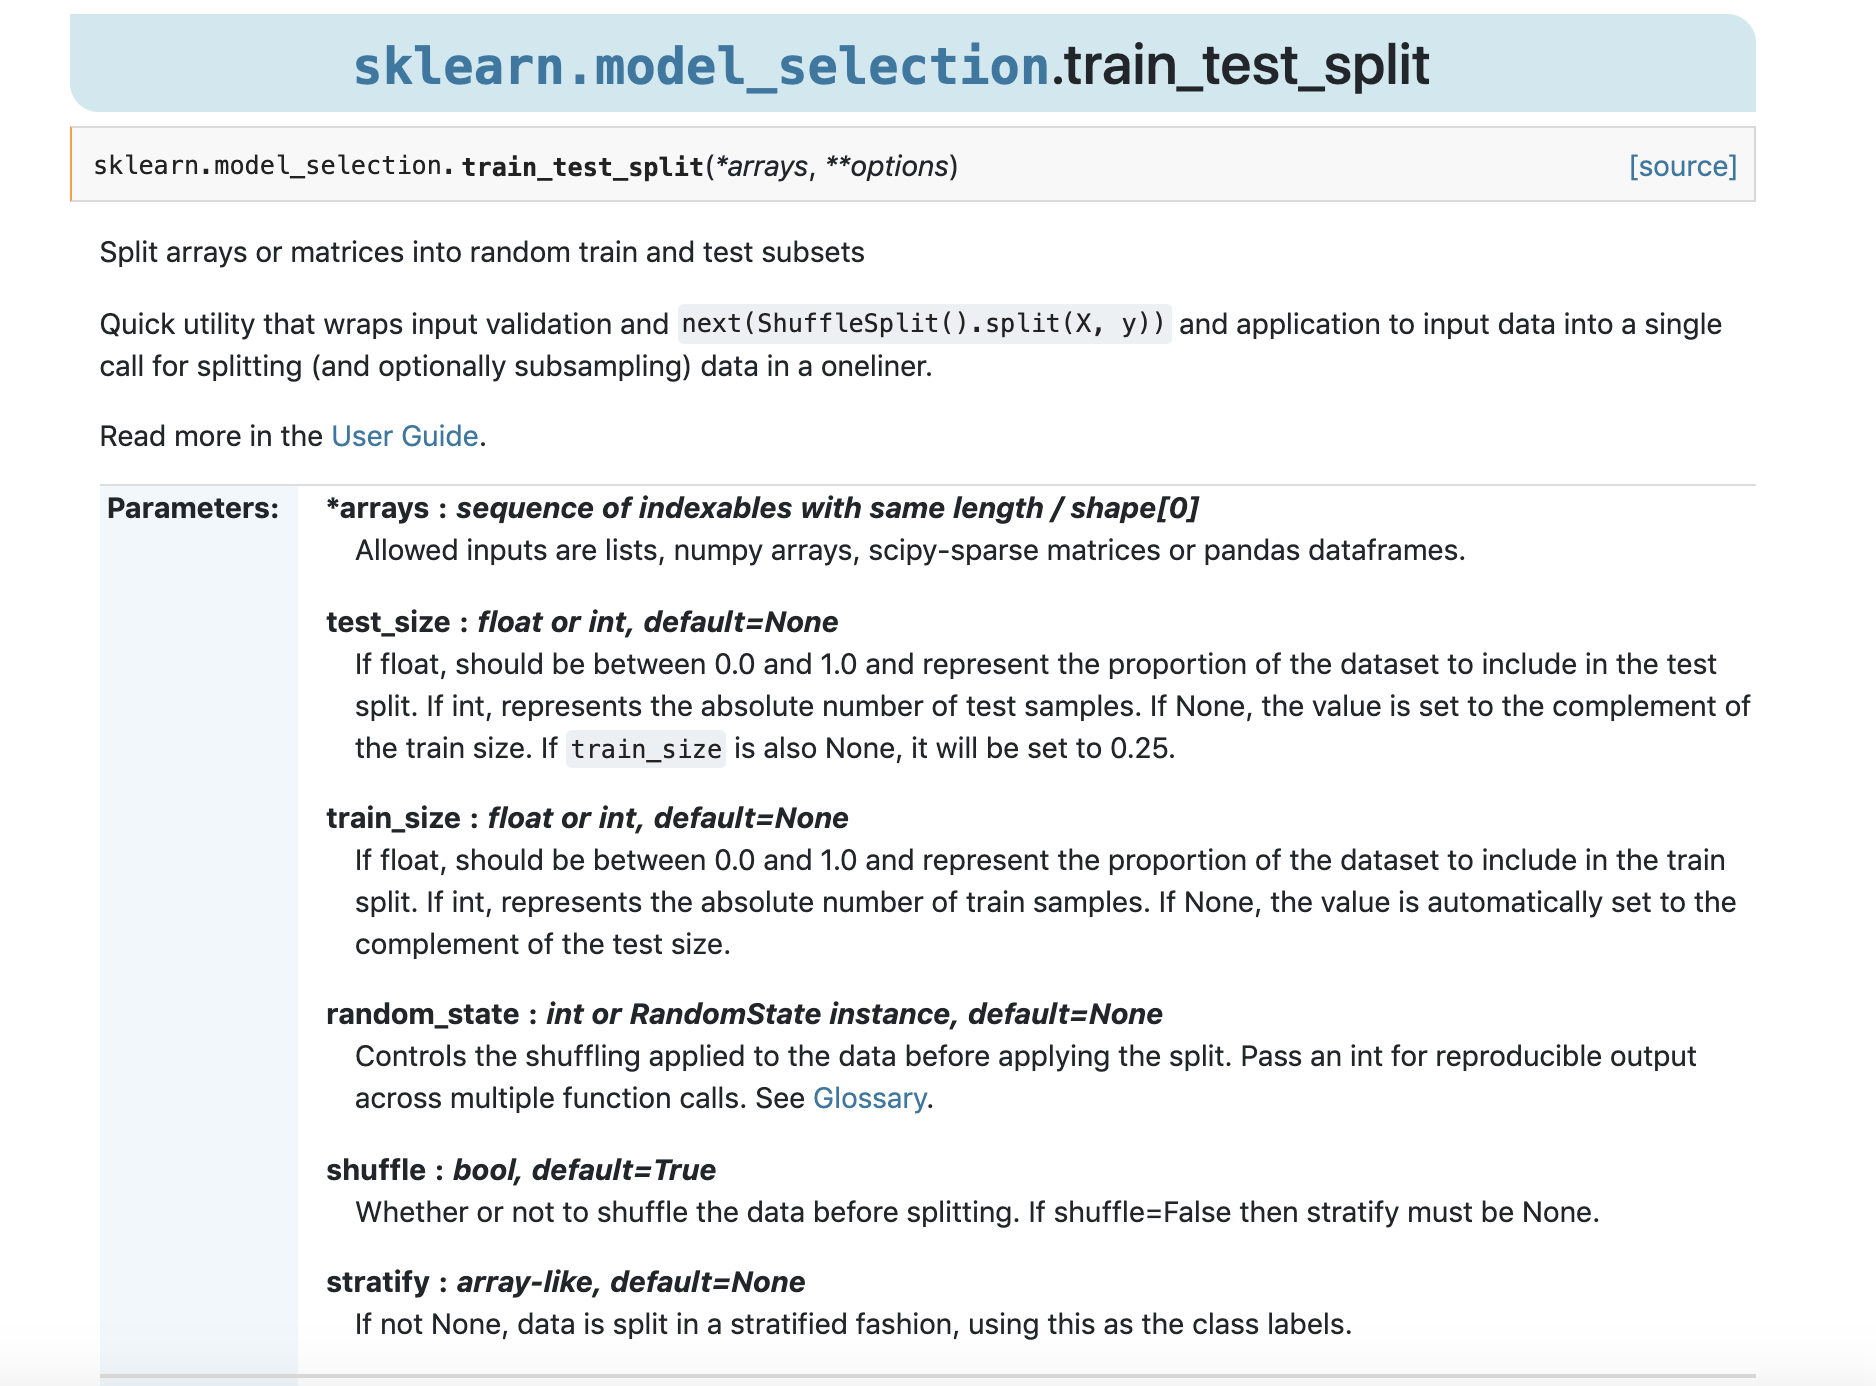
from sklearn.model_selection import train_test_split

# Split the dataset
X_train, X_test, y_train, y_test = train_test_split(
    X, y, test_size=0.2, random_state=123)
X_train.head(3)
X_test.head(3)
y_train.head(3)
160    Canada
127    Canada
169    Canada
Name: country, dtype: object
y_test.head(3)
172    Canada
175    Canada
181    Canada
Name: country, dtype: object
shape_dict = {"Data portion": ["X", "y", "X_train", "y_train", "X_test", "y_test"],
    "Shape": [X.shape, y.shape,
              X_train.shape, y_train.shape,
              X_test.shape, y_test.shape]}

shape_df = pd.DataFrame(shape_dict)
shape_df
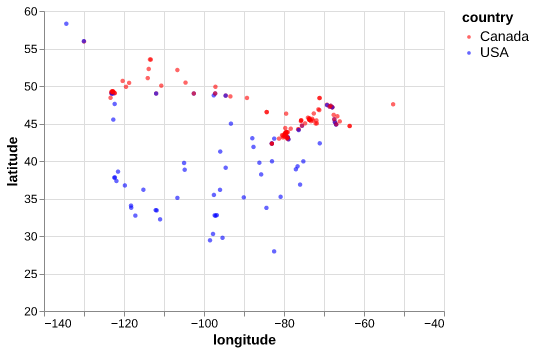
train_df, test_df = train_test_split(cities_df, test_size = 0.2, random_state = 123)

X_train, y_train = train_df.drop(columns=["country"]), train_df["country"]

X_test, y_test = test_df.drop(columns=["country"]), test_df["country"]

train_df.head()
chart_cities = alt.Chart(train_df).mark_circle(size=20, opacity=0.6).encode(
    alt.X('longitude:Q', scale=alt.Scale(domain=[-140, -40])),
    alt.Y('latitude:Q', scale=alt.Scale(domain=[20, 60])),
    alt.Color('country:N', scale=alt.Scale(domain=['Canada', 'USA'],
                                           range=['red', 'blue'])))
chart_cities
from sklearn.tree import DecisionTreeClassifier

model = DecisionTreeClassifier()
model.fit(X_train, y_train);
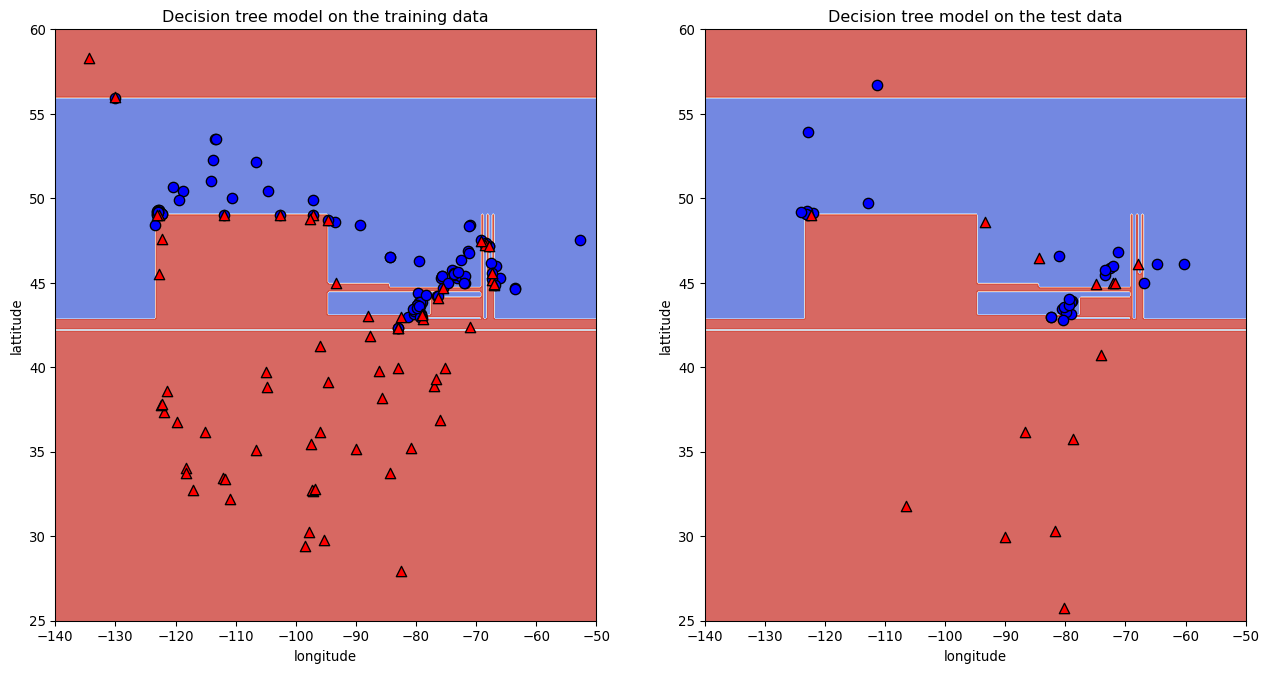
print("Train score: " + str(round(model.score(X_train, y_train), 2)))
print("Test score: " + str(round(model.score(X_test, y_test), 2)))
Train score: 1.0
Test score: 0.74
train_df, test_df = train_test_split(cities_df, test_size = 0.2, random_state = 123)
shape_dict2 = {"Data portion": ["cities_df", "train_df", "test_df"],
    "Shape": [cities_df.shape, train_df.shape,
              test_df.shape]}

shape_df2 = pd.DataFrame(shape_dict2)
shape_df2
train_df_rs5, test_df_rs5 = train_test_split(cities_df, test_size = 0.2, random_state = 5)
train_df_rs7, test_df_rs7 = train_test_split(cities_df, test_size = 0.2, random_state = 7)
train_df_rs5.head(3)
train_df_rs7.head(3)