Attribution
cities_df = pd.read_csv("data/canada_usa_cities.csv")
train_df, test_df = train_test_split(cities_df, test_size=0.2, random_state=123)
train_df.head()
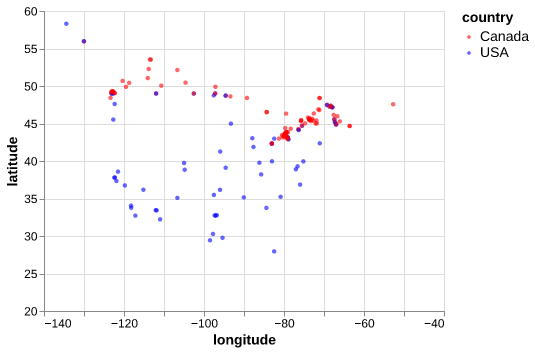
cities_plot = alt.Chart(train_df).mark_circle(size=20, opacity=0.6).encode(
    alt.X('longitude:Q', scale=alt.Scale(domain=[-140, -40])),
    alt.Y('latitude:Q', scale=alt.Scale(domain=[20, 60])),
    alt.Color('country:N', scale=alt.Scale(domain=['Canada', 'USA'],
                                           range=['red', 'blue']))
)
cities_plot
grades_df = pd.read_csv("data/quiz2-grade-toy-classification.csv")
grades_df.head()
X = grades_df.drop(columns=['quiz2'])
X.shape[1]
7
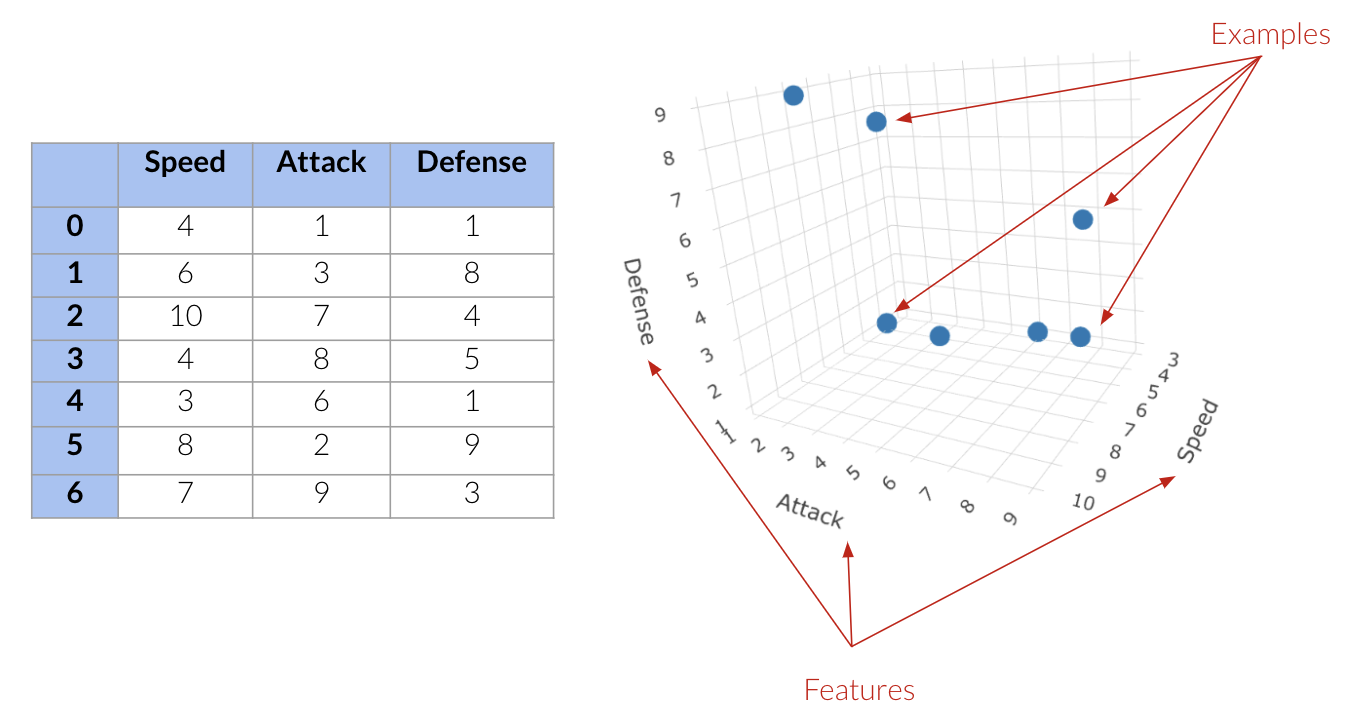
Dimensions:
Feature vector: a vector composed of feature values associated with an example.
train_df.head()
An example feature vector from the cities dataset:
train_df.drop(columns=["country"]).iloc[0].round(2).to_numpy()
array([-76.48, 44.23])
An example feature vector from the grading dataset:
grades_df.drop(columns=['quiz2']).iloc[0].round(2).to_numpy()
array([ 1, 1, 92, 93, 84, 91, 92])