
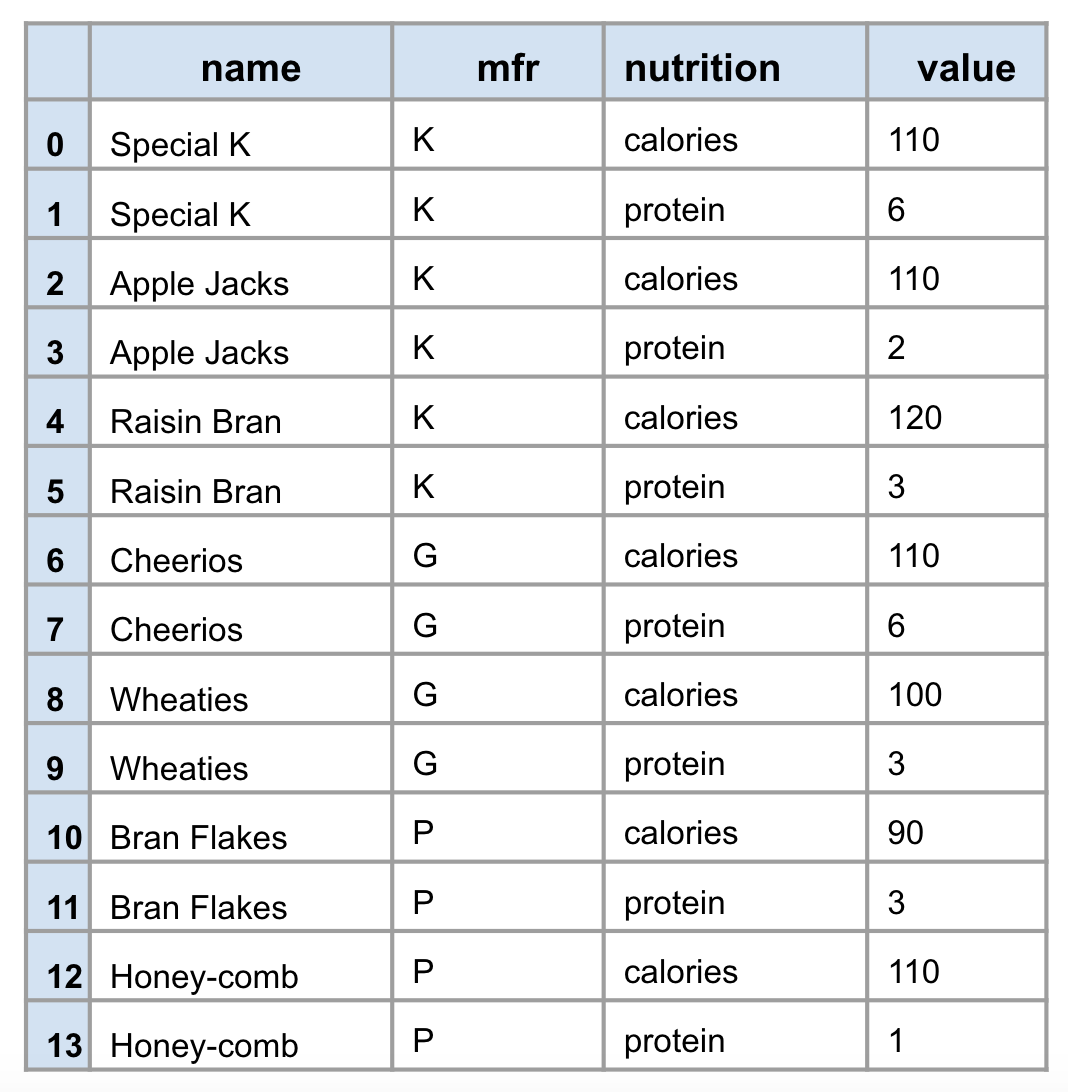
cereal2| name | mfr | nutrition | value | |
|---|---|---|---|---|
| 0 | Apple Jacks | K | protein | 2 |
| 1 | Bran Flakes | P | protein | 3 |
| 2 | Cheerios | G | protein | 6 |
| ... | ... | ... | ... | ... |
| 11 | Raisin Bran | K | calories | 120 |
| 12 | Special K | K | calories | 110 |
| 13 | Wheaties | G | calories | 100 |
14 rows × 4 columns
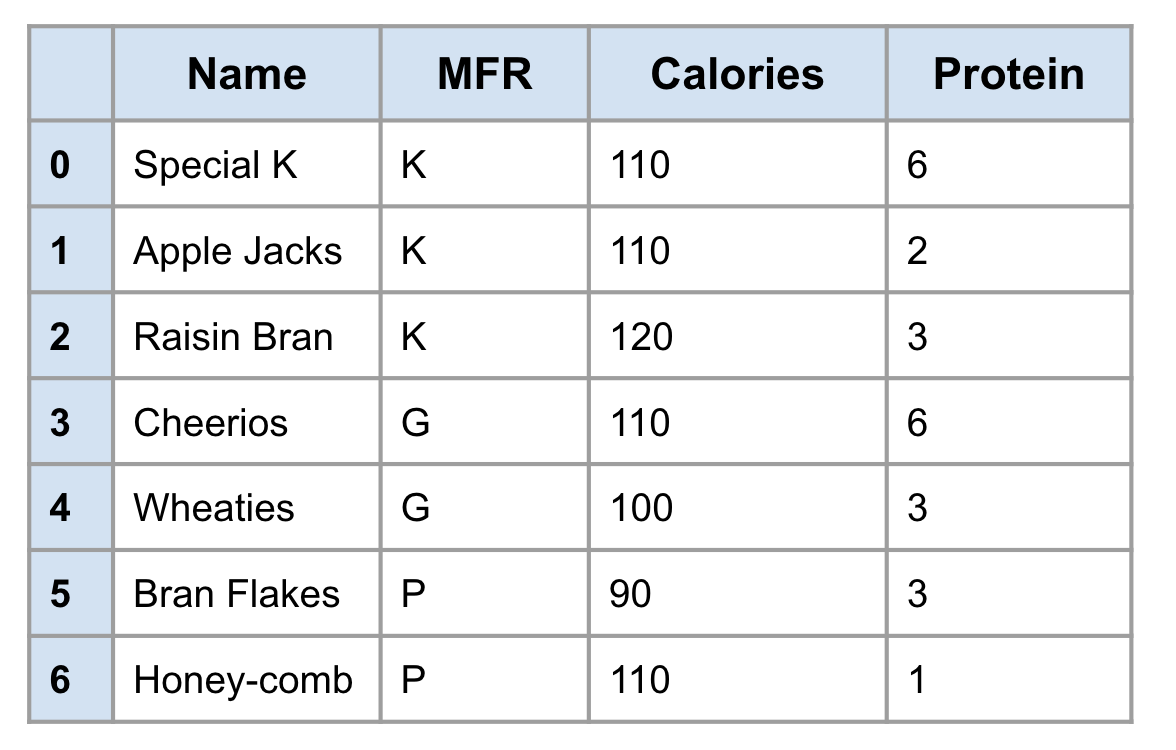
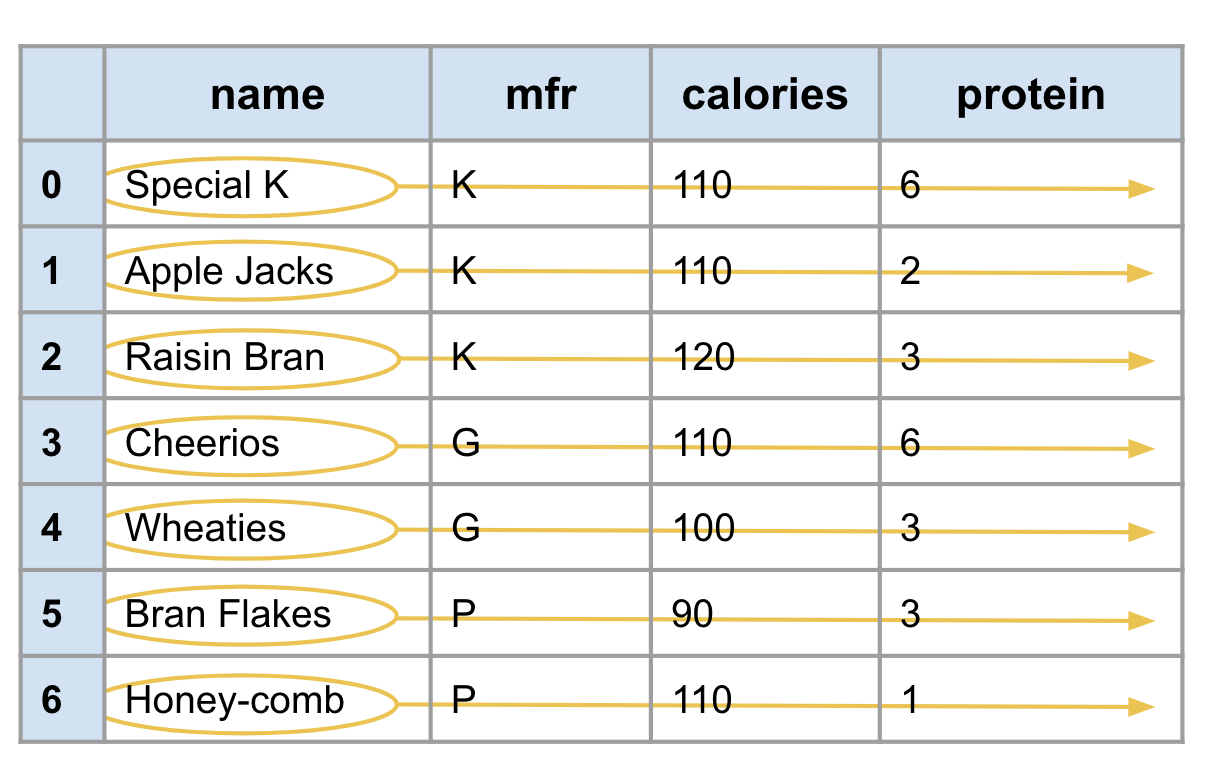
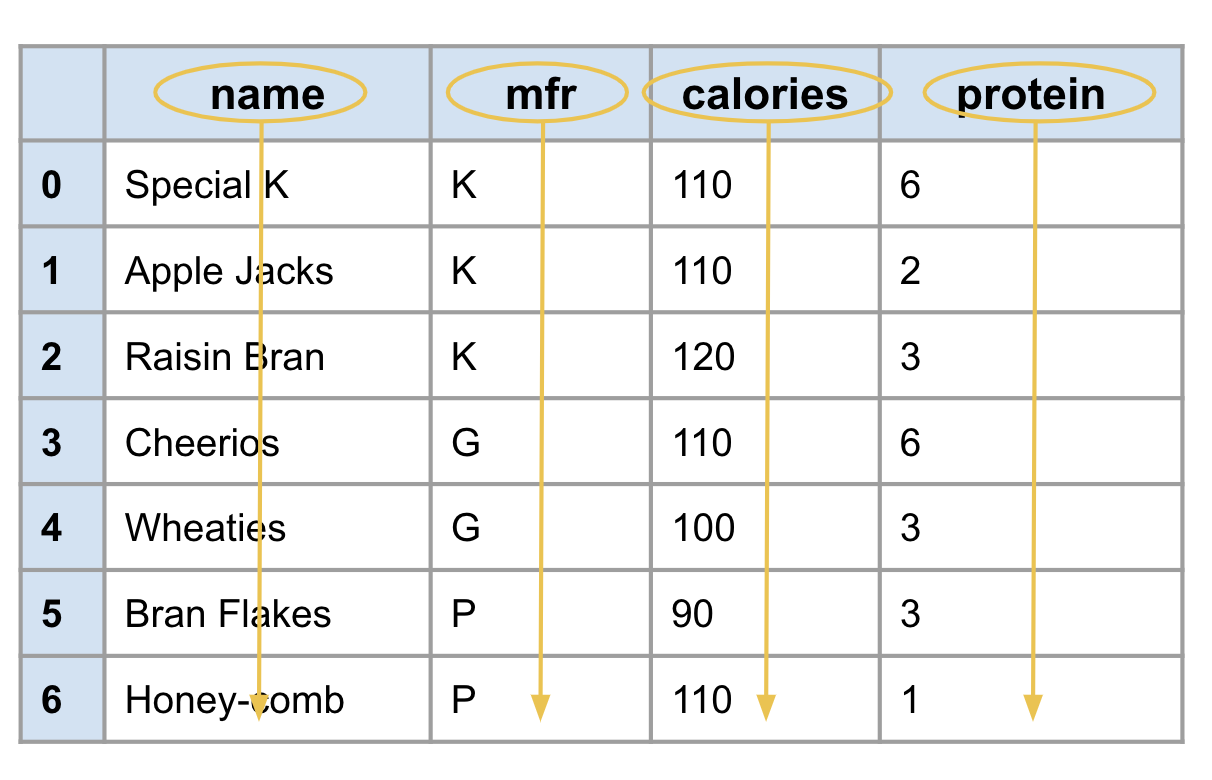
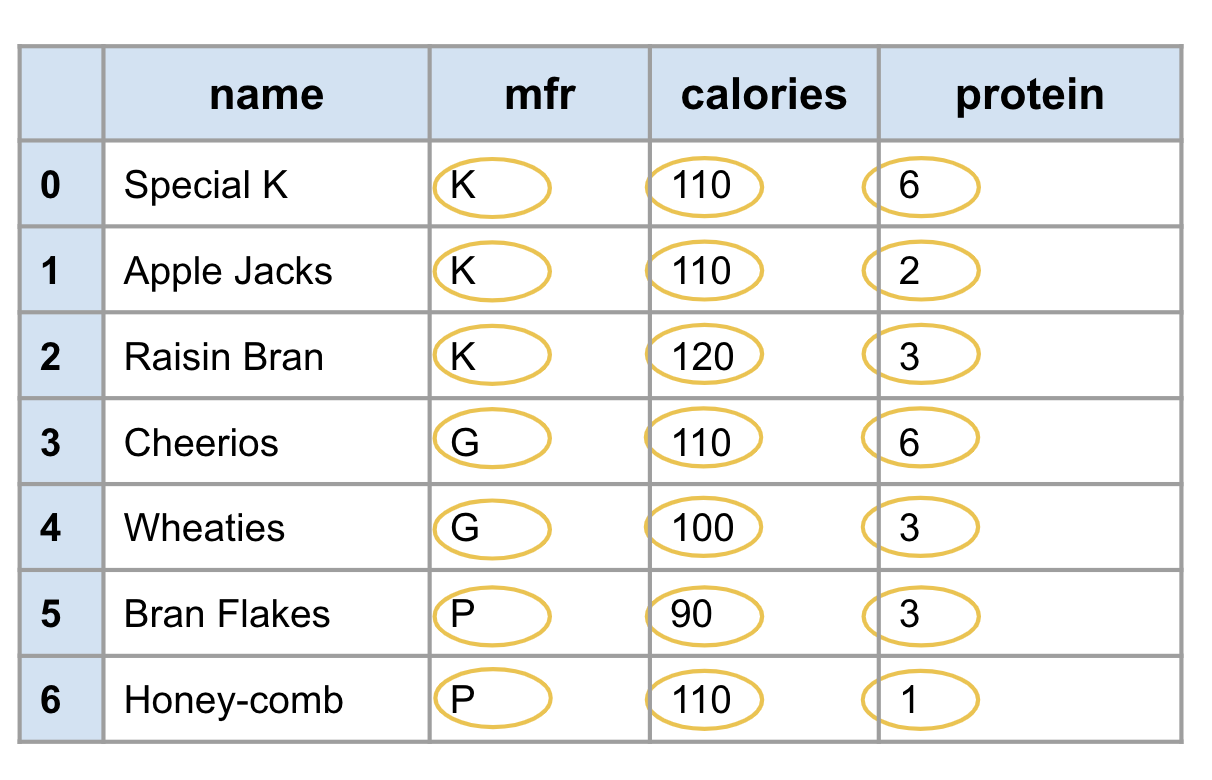
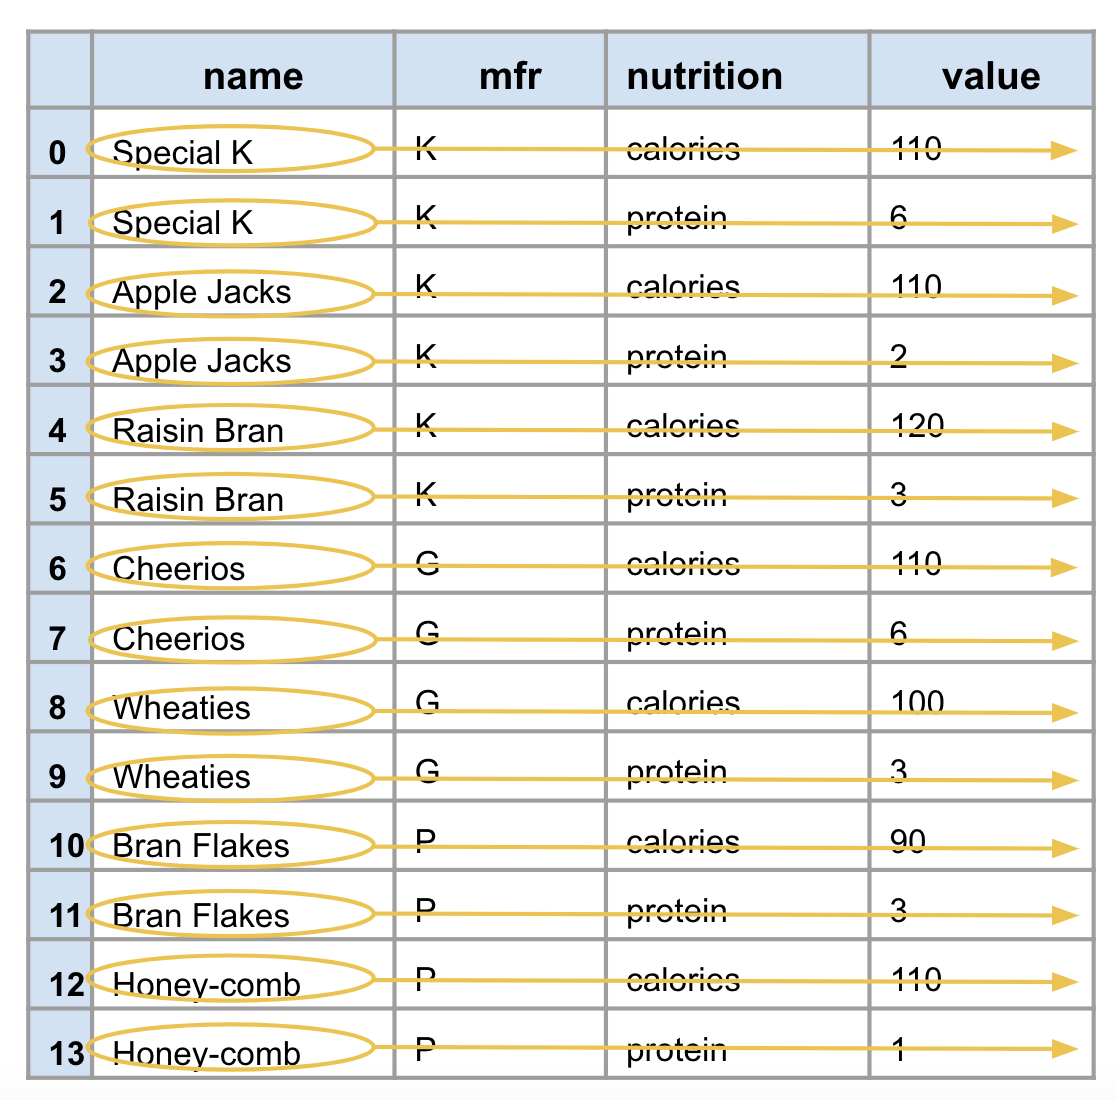
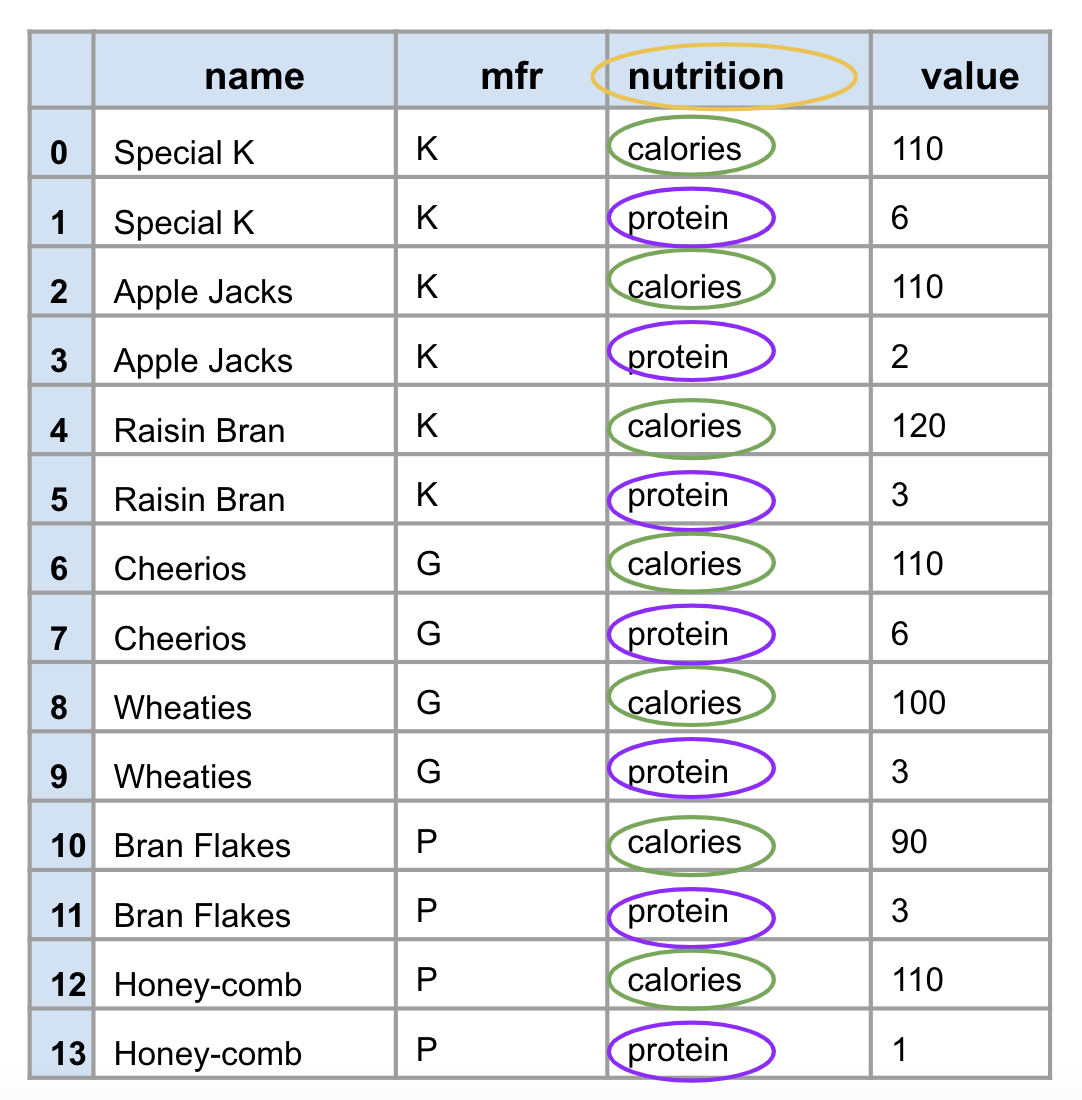
Tidy data satisfies the following three criteria:
Image Source: R for Data Science by Garrett Grolemund & Hadley Wickham
What a variable and an observation is may depend on your immediate goal.
Are protein and calories content associated with different cereal manufacturers?