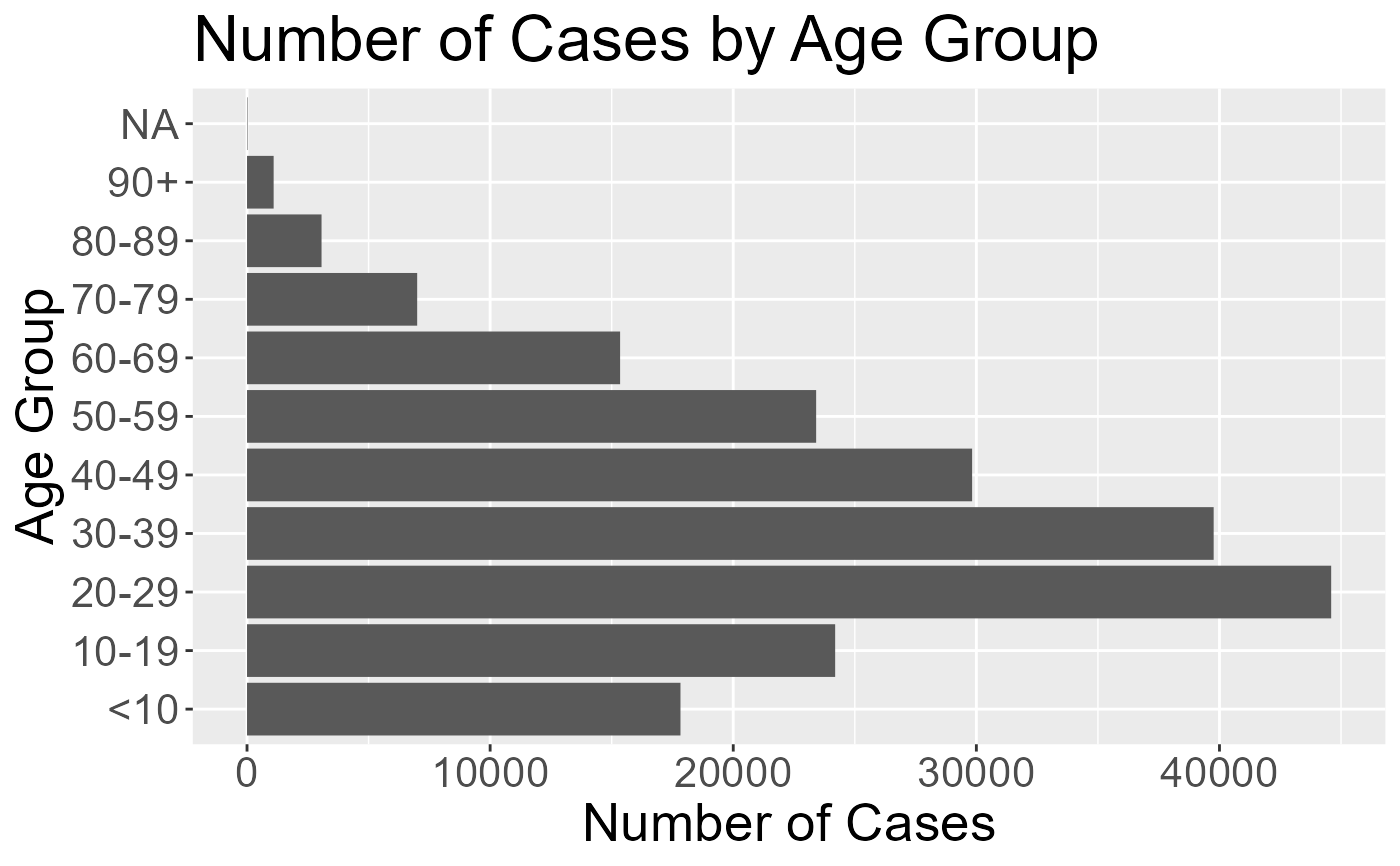
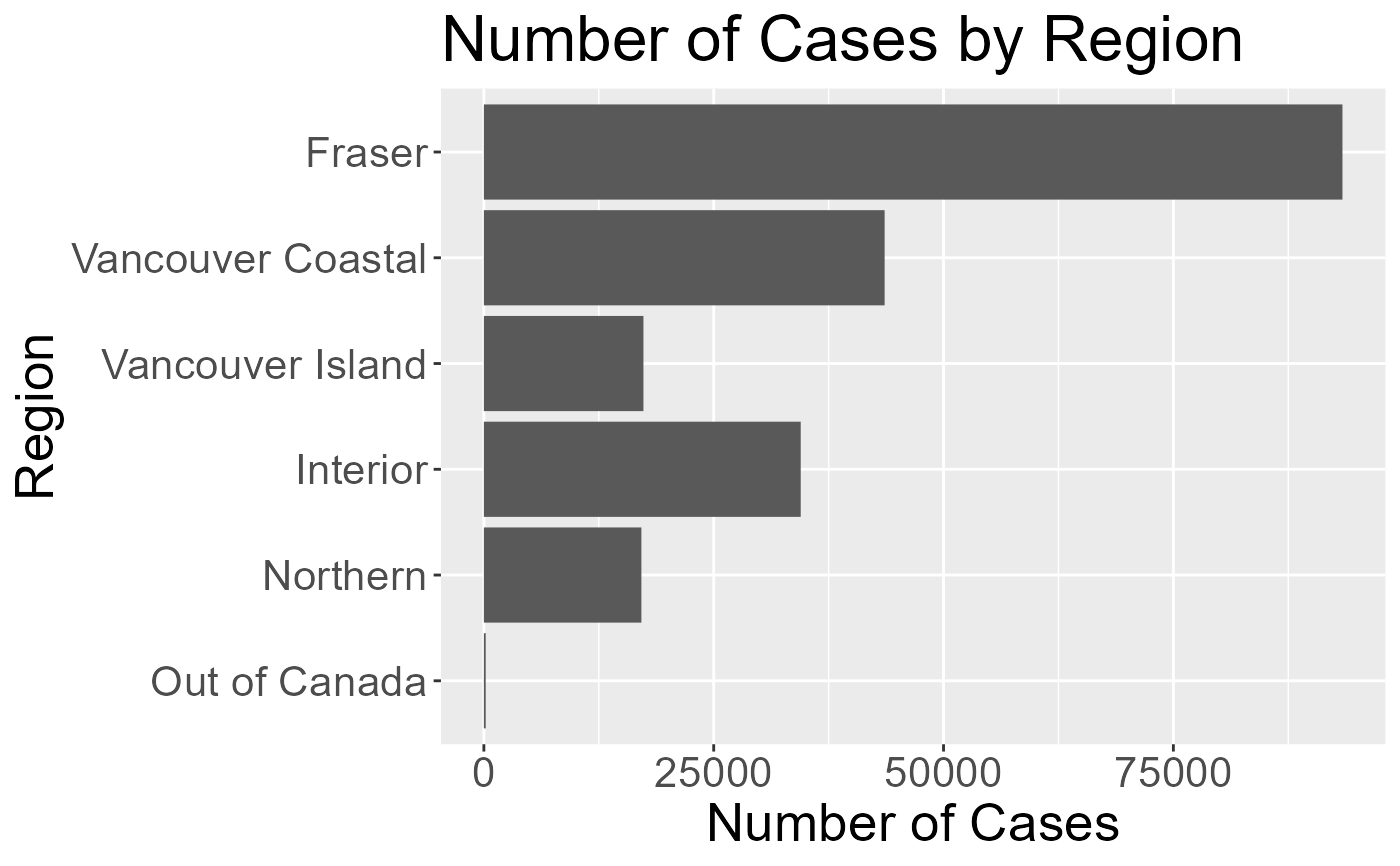
Plots the number of Covid19 cases with respect to the condition(per Age Group or Region) using histogram for the period specified by startDate and endDate
plot_hist_by_cond(startDate, endDate, condition)Arguments
- startDate
string the start date of the period (no earlier than '2020-01-29')
- endDate
string the end date of the period (no later than today)
- condition
string available condition - Age, Region
Value
ggplot object
Examples
plot_hist_by_cond("2021-01-01", "2021-12-31", "Age")

plot_hist_by_cond("2021-01-01", "2021-12-31", "Region")
