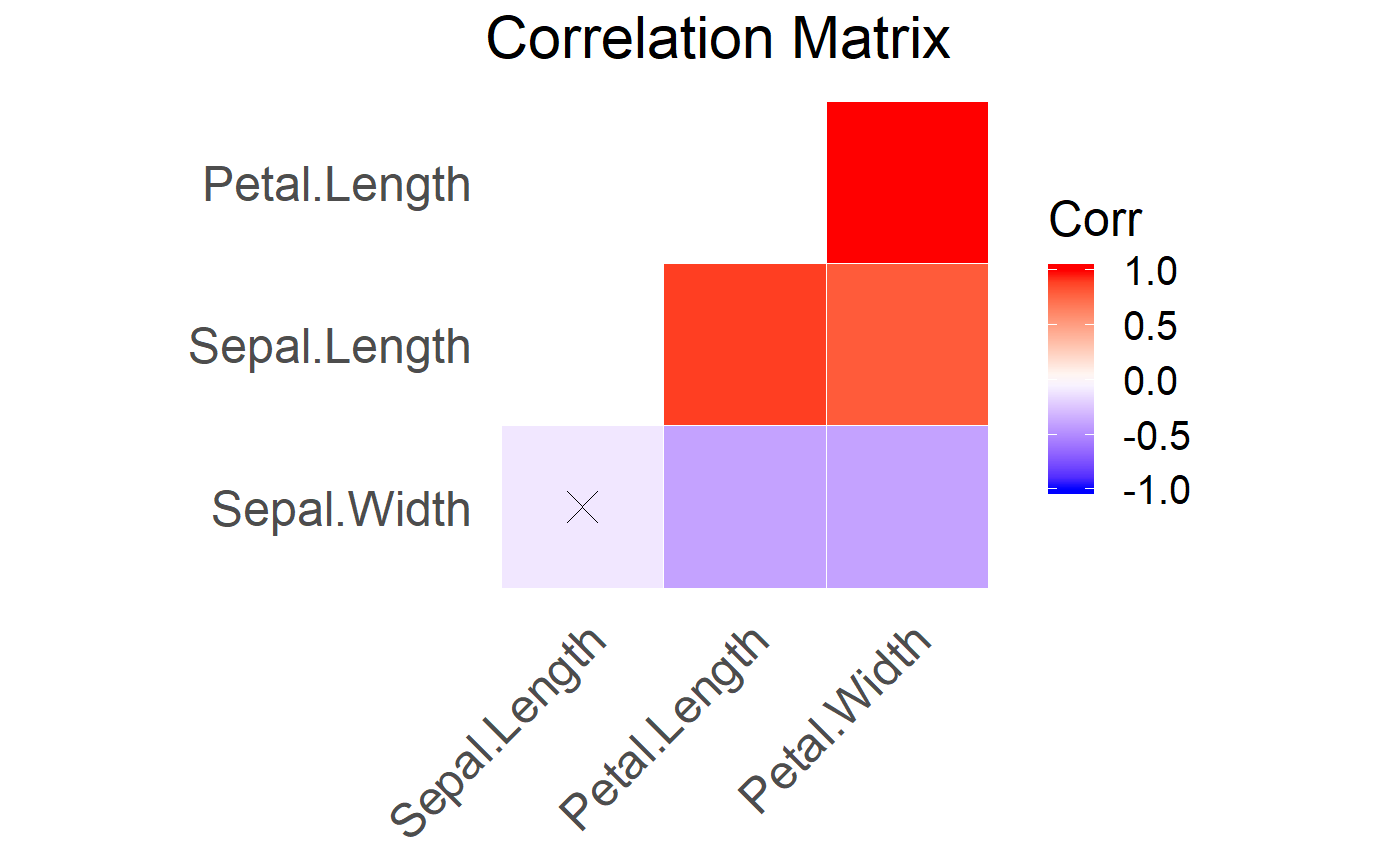
The function takes in a dataframe/tibble and a vector of column names and creates a correlation matrix. The correlation matrix can only include numeric columns
fast_corr(df, selected_columns)
Arguments
| df | The data that will be plotted |
|---|---|
| selected_columns | The vector of column names to be included in correlation matrix |
Value
plot object
Examples
#> [1] "Removed 1 non-numberical columns from your selected columns"#> [1] "Removed 1 non-numberical columns from your selected columns"

