Creating a boxplot visualisation of statistics for either teams or player positions based on ESPN NBA data
Source:R/nba_boxplot.R
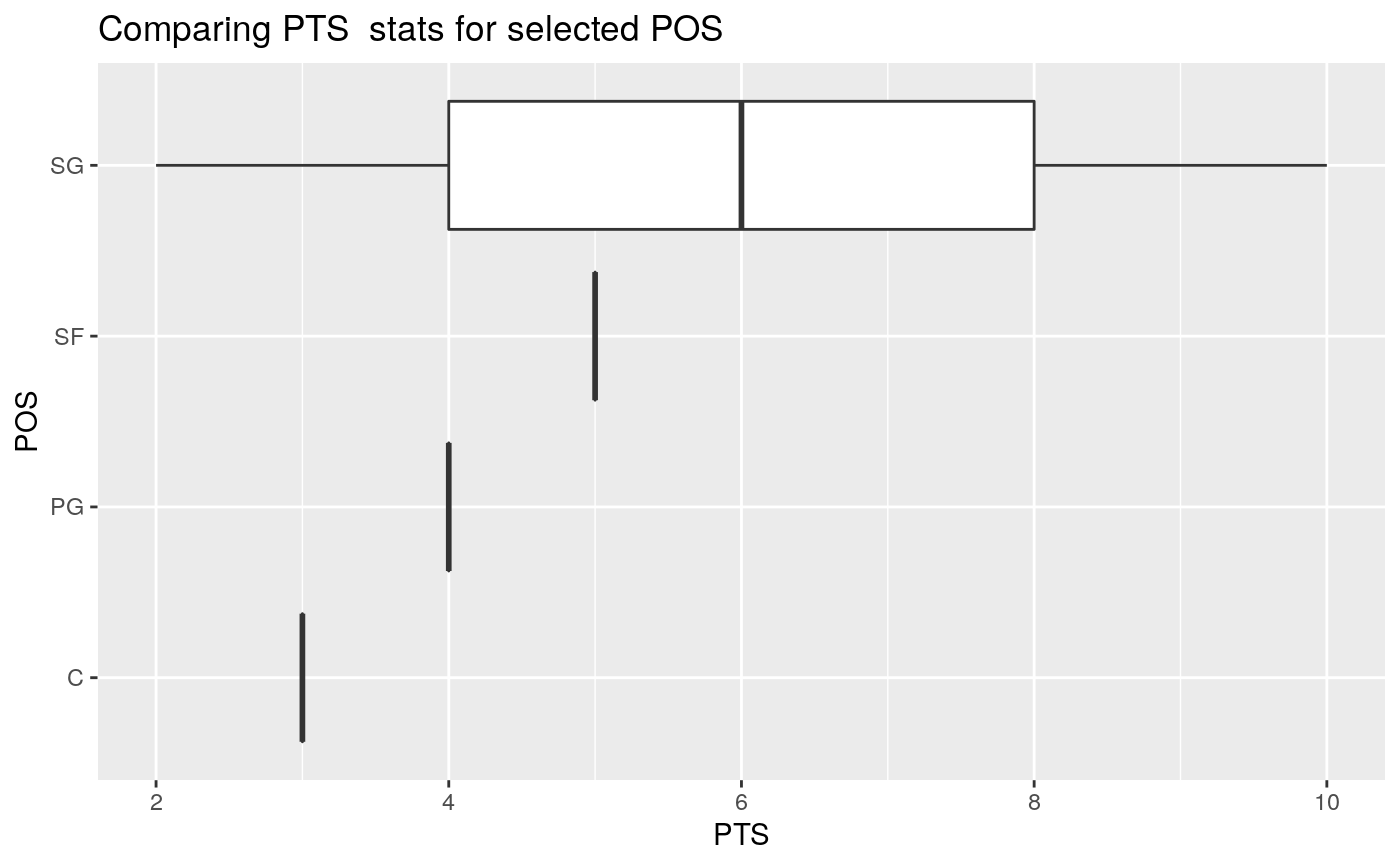
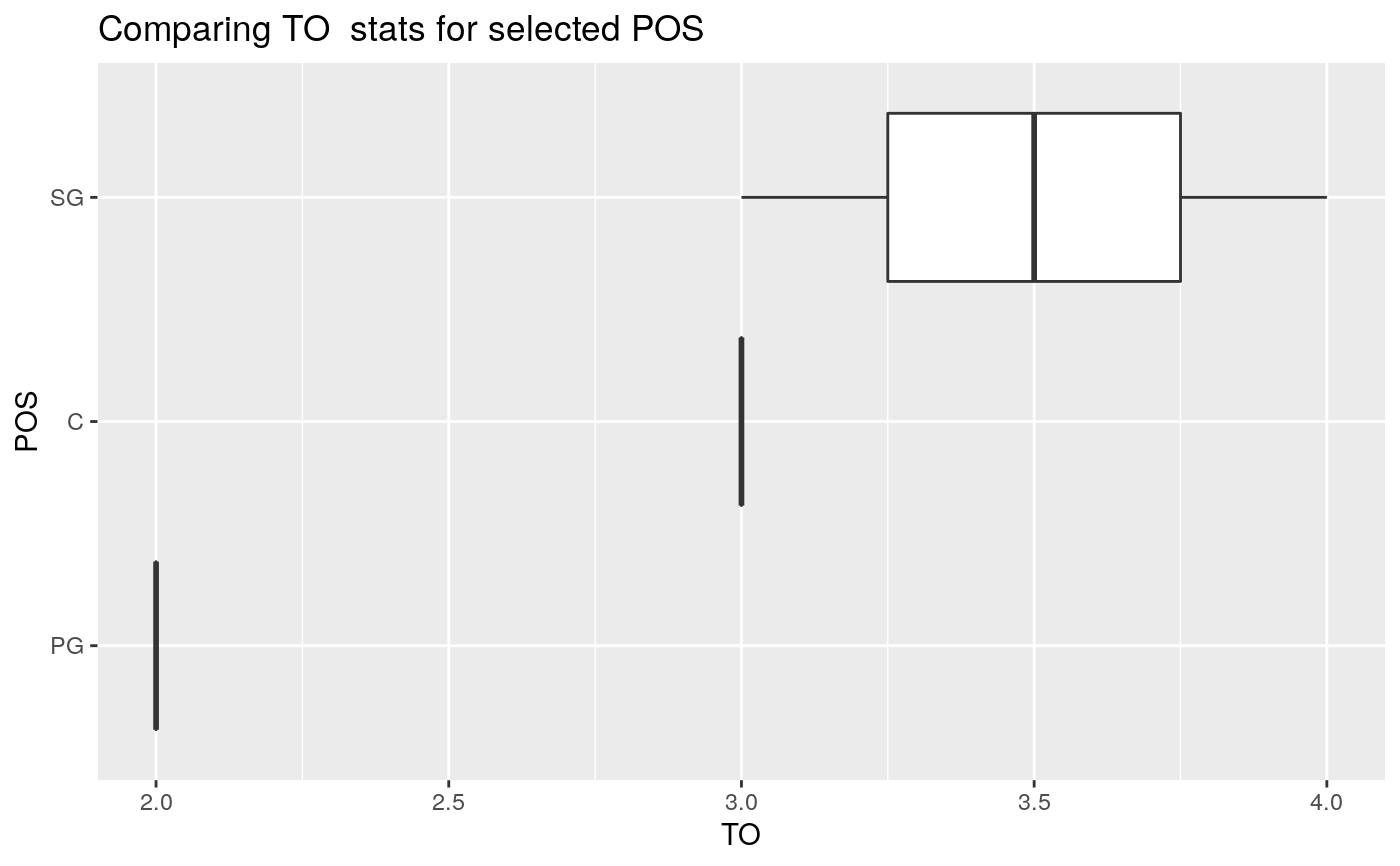
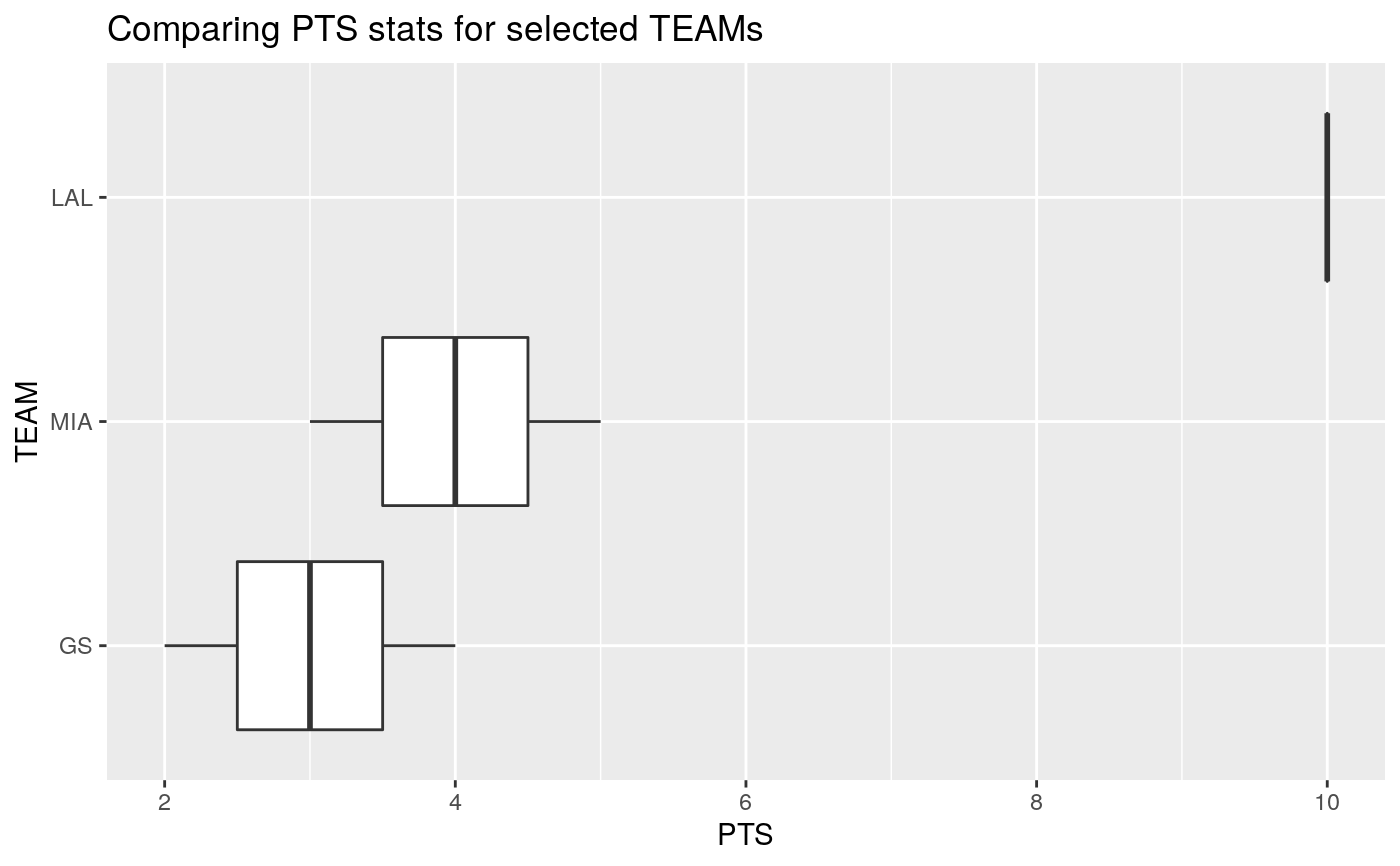
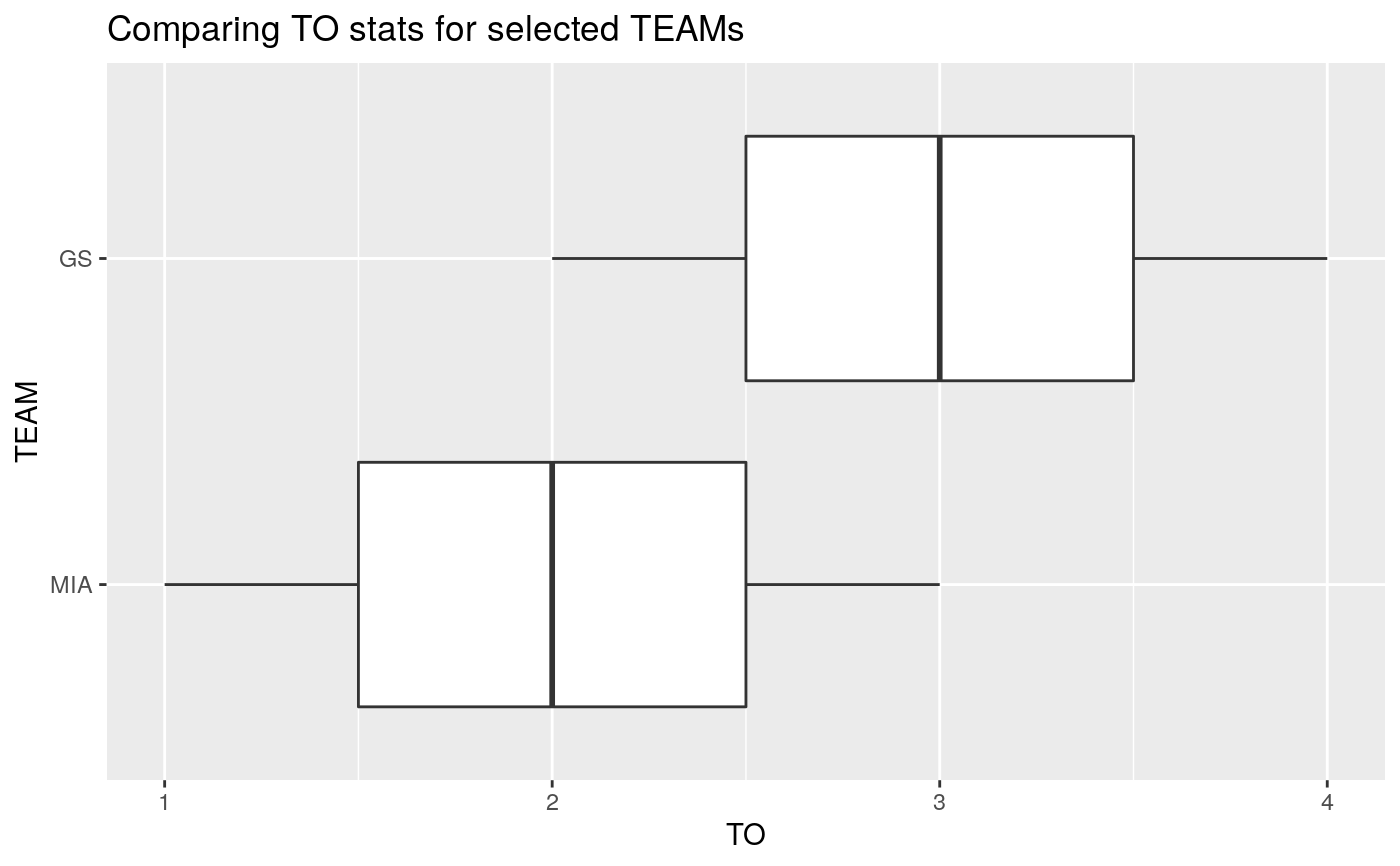
nba_boxplot.RdThis function creates a boxplot of the categorical variable of interest on the y-axis and the statistic of interest on the x-axis.
nba_boxplot(
  nba_data,
  team_or_position = "position",
  grouping_list = c(NULL),
  stats_column
)
Arguments
| nba_data | tibble This dataframe is created after using the nba_scraper.R function or if the csv has already been loaded, read the csv in and pass it as the parameter. |
|---|---|
| team_or_position | string To specify if you want a boxplot for either "team" or "position" grouping |
| grouping_list | string The grouping list for either "team" or "position". For "team", examples of grouping_list can be c("HOU","GS") For "position, examples of grouping_list can be c("PG","C"). If grouping_list is empty, function will return boxplot of all groups in either "team" or "position". |
| stats_column | non-string character input as per column name The numeric variable of interest in the columns of the scraped NBA dataframe. Examples: PTS (Points), 3PM (3 Pointers Made), FT% (Free Throw Percent). Note that if a column name starts with a number (eg 3PA) or has % in it (eg 3P%, FT%), format it with backticks. See vignette for examples. |
Value
ggplot boxplot
Details
For reference on the scraped data columns information, please refer to the dataset description: https://github.com/UBC-MDS/rsketball/blob/master/dataset_description.md
For detailed use cases, please refer to the vignette: https://ubc-mds.github.io/rsketball/articles/rsketball-vignette.html
Examples
nba_data <- tibble::tibble(NAME = c("James", "Steph", "Bosh", "Klay", "Kobe"), TEAM = c("MIA","GS","MIA","GS","LAL"), POS = c("SF", "PG", "C", "SG", "SG"), PTS = c(5,4,3,2,10), TO = c(1,2,3,4,3)) # Boxplot of all player positions based on PTS nba_boxplot(nba_data, team_or_position = "position", grouping_list = NULL, stats_column = PTS)# Boxplot of specific player positions based on TO nba_boxplot(nba_data, team_or_position = "position", grouping_list = c("C","PG","SG"), stats_column = TO)# Boxplot of all teams based on PTS nba_boxplot(nba_data, team_or_position = "team", grouping_list = NULL, stats_column = PTS)# Boxplot of specific teams based on TO nba_boxplot(nba_data, team_or_position = "team", grouping_list = c("MIA","GS"), stats_column = TO)