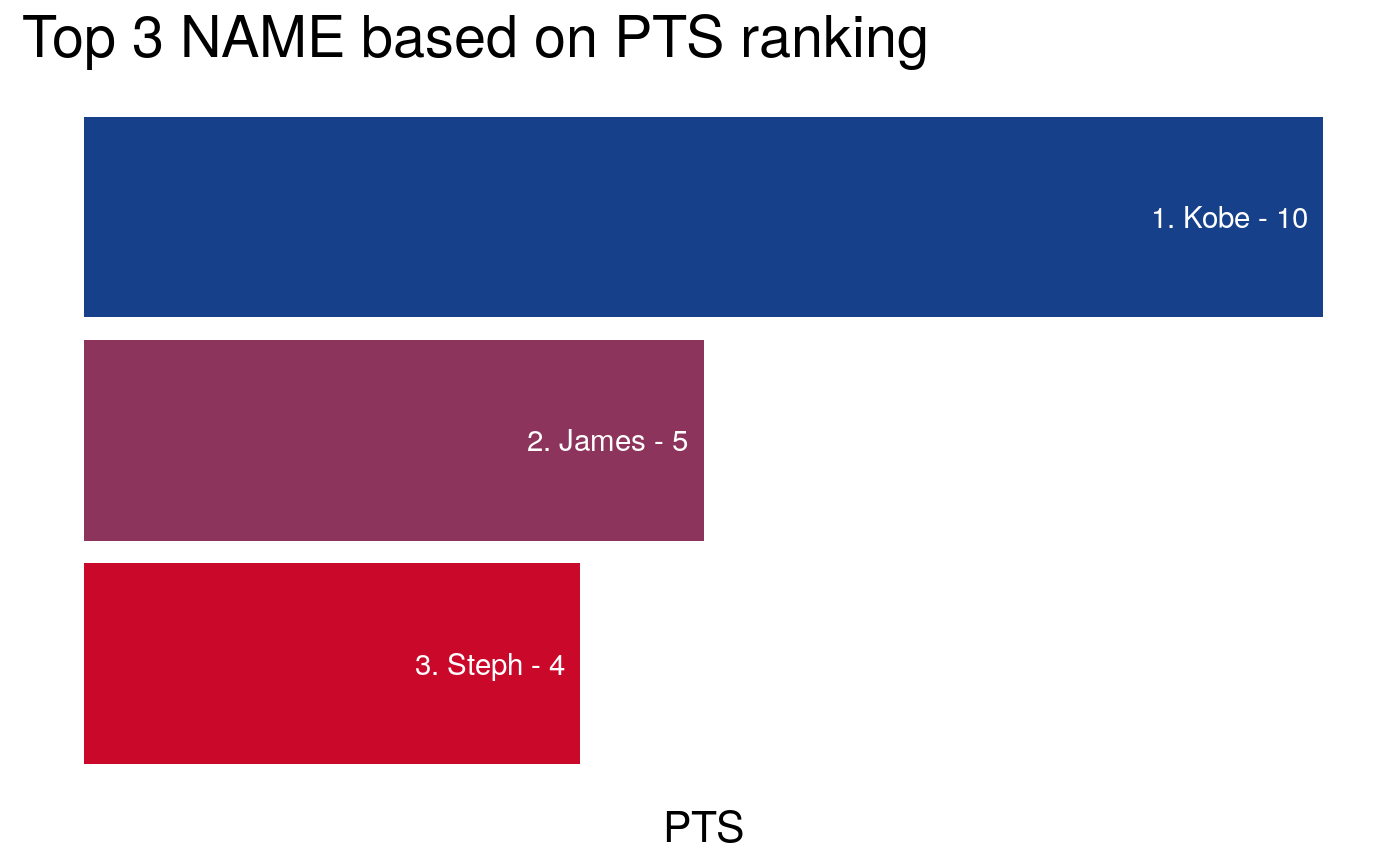
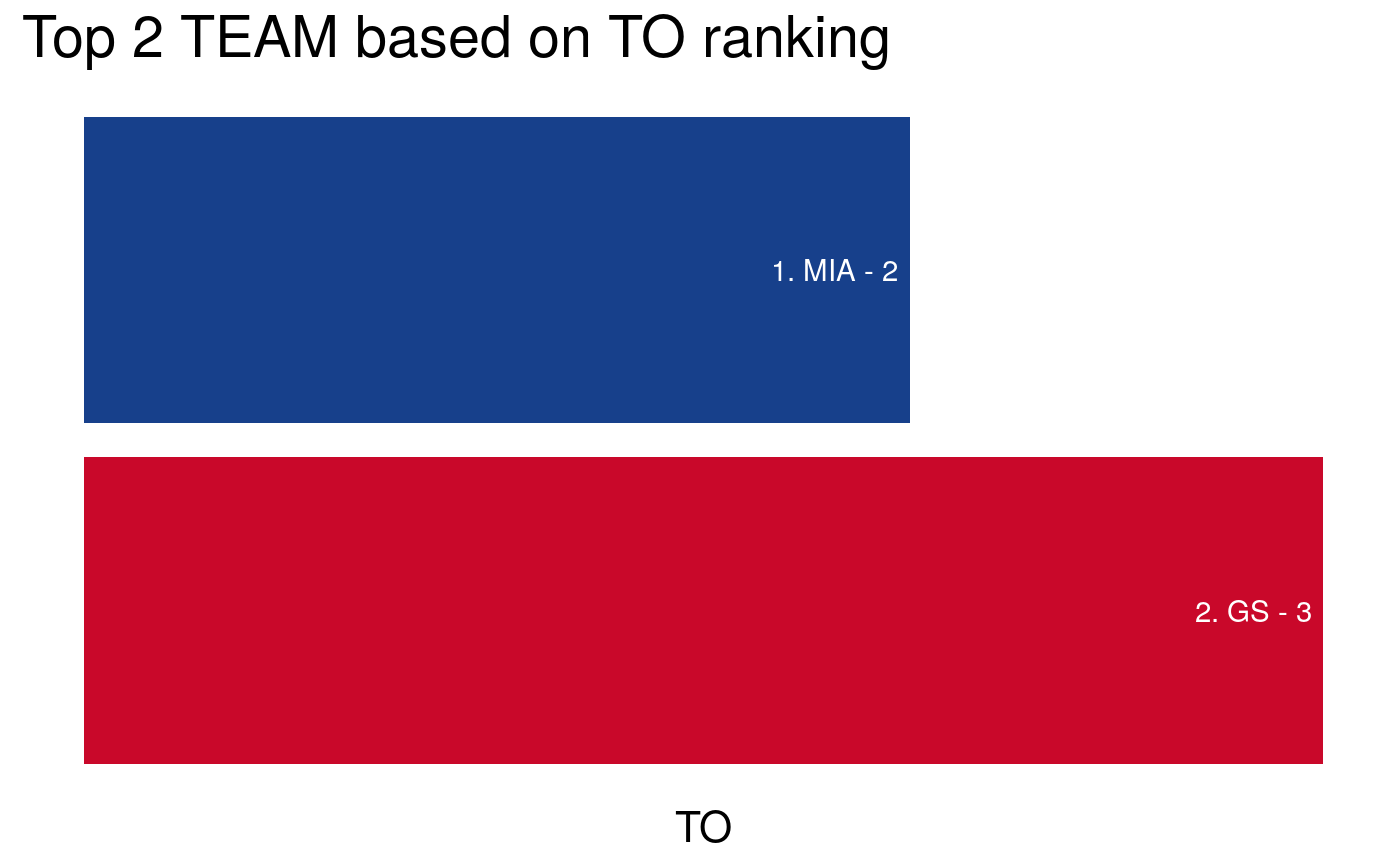
Generates a ranking and a visualization based on ESPN NBA data
Source:R/nba_ranking.R
nba_ranking.RdThis function generates creates a ranking of a variable `column` summarizing by a variable `by` using a function `FUN`. The result of this function is a visualization with that information.
For reference on the scraped data columns information, please refer to the dataset description: https://github.com/UBC-MDS/rsketball/blob/master/dataset_description.md
For detailed use cases, please refer to the vignette: https://ubc-mds.github.io/rsketball/articles/rsketball-vignette.html
nba_ranking(nba_data, column, by, top = 5, descending = TRUE, FUN = mean)
Arguments
| nba_data | The tibble dataframe from the scraped nba data |
|---|---|
| column | The categorical column from the dataset to rank. Should be either "NAME", "TEAM" or "POS" |
| by | The column from the dataset to rank by. Should be the statistic numerical column of interest. If the column starts with a number (eg 3PA) or has a % character (eg FT%), format it with backticks "`". Refer to vignette for more examples on this. |
| top | The number of elements in the ranking. Defaults to 5. |
| descending | Boolean variable for the order of the ranking. TRUE if descending, FALSE otherwise. Defaults to True. |
| FUN | function to apply to the values. Defaults to the Mean function. |
Value
ggplot visualization with the ranking
Examples
nba_data <- tibble::tibble(NAME = c("James", "Steph", "Bosh", "Klay", "Kobe"), TEAM = c("MIA","GS","MIA","GS","LAL"), POS = c("SF", "PG", "C", "SG", "SG"), PTS = c(5,4,3,2,10), TO = c(1,2,3,4,3)) # Find top 3 players for points (PTS) where higher is better nba_ranking(nba_data, column = NAME, by = PTS, top = 3, descending = TRUE, FUN = mean)#' # Find top 2 teams for turnover (TO) where lower is better nba_ranking(nba_data, column = TEAM, by = TO, top = 2, descending = FALSE, FUN = mean)

