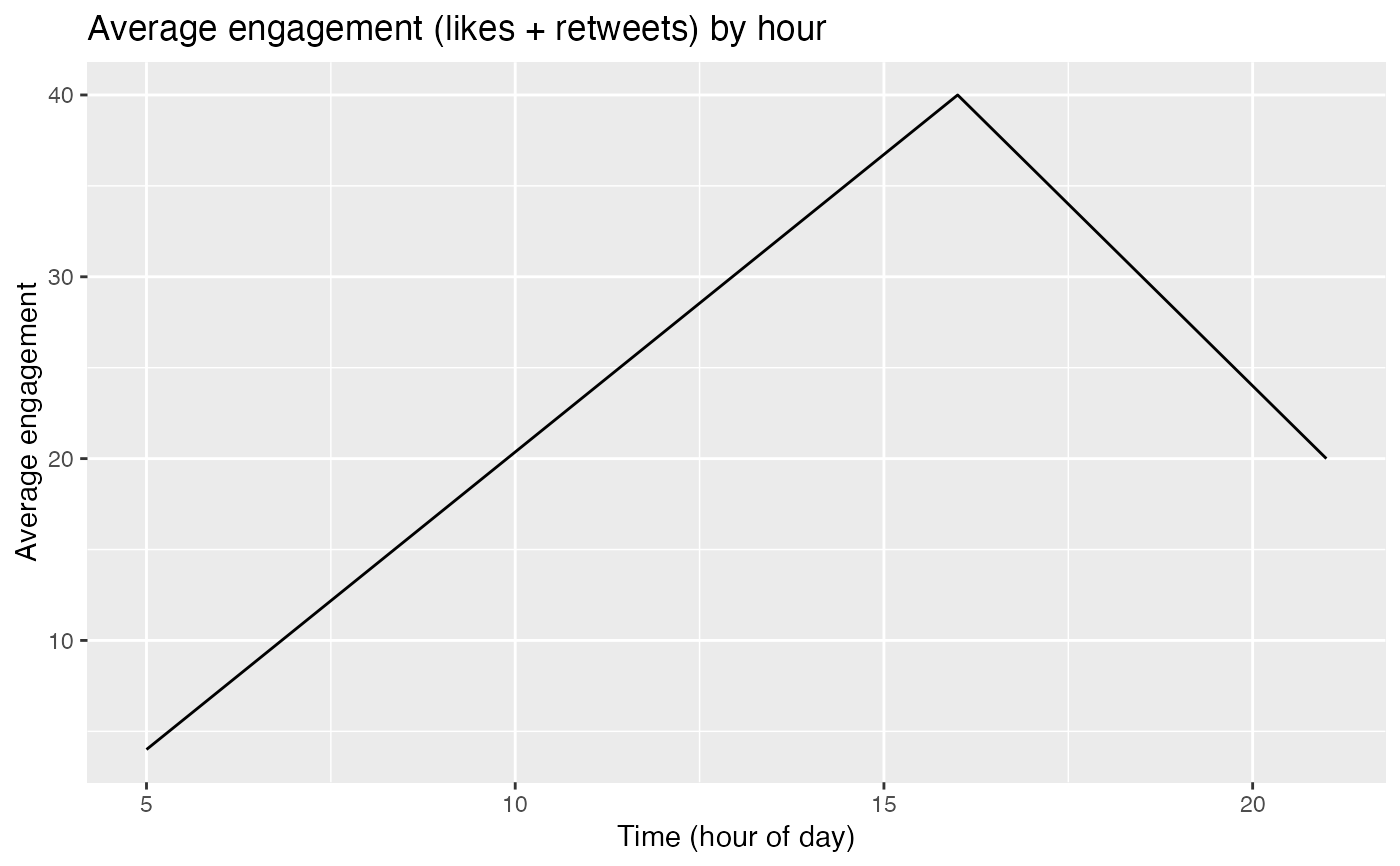
Creates a line chart of average number of likes and retweets received based on hour of tweet posted.
engagement_by_hour(tweets_df)
Arguments
| tweets_df | dataframe |
|---|
Value
ggplot object
Examples
my_tweets <- data.frame (created_at  = c("2021-03-06 16:03:31", "2021-03-05 21:57:47", '2021-03-05 05:50:50'),
favorite_count = c(20, 10, 2),
retweet_count = c(20, 10, 2))
engagement_by_hour(my_tweets)