Create a sample histogram from a population
Source:R/create_sample_histograms.R
create_sample_histograms.RdThis function creates a grid of sample distributions from a population for different sample sizes.
create_sample_histograms(pop, samples, var_name, sample_size)
Arguments
| pop | the virtual population as a tibble |
|---|---|
| samples | the samples as a tibble |
| var_name | the name of the column for the variable that is being generated |
| sample_size | a vector of the sample sizes |
Value
a list of the sample histogram plots
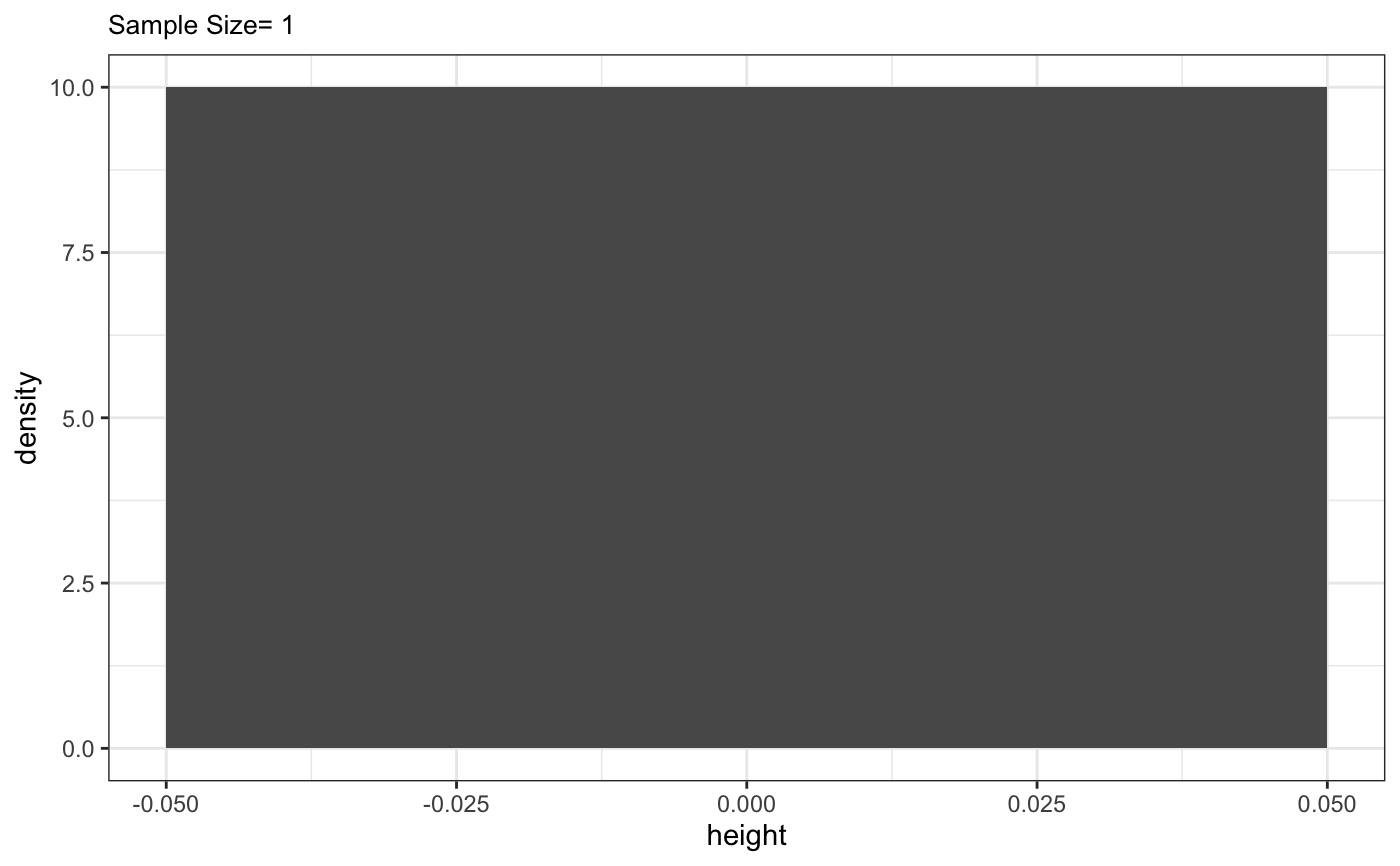
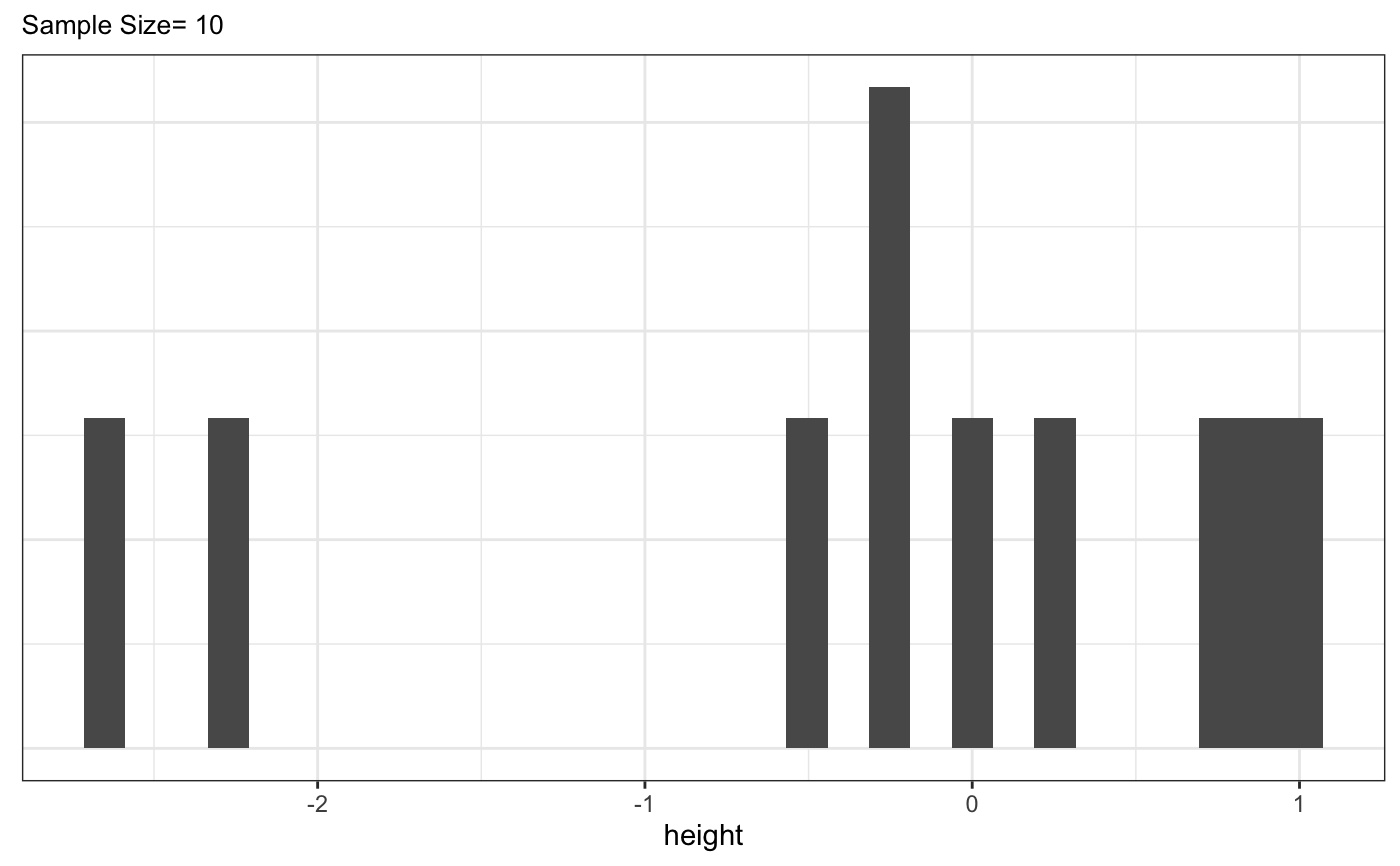
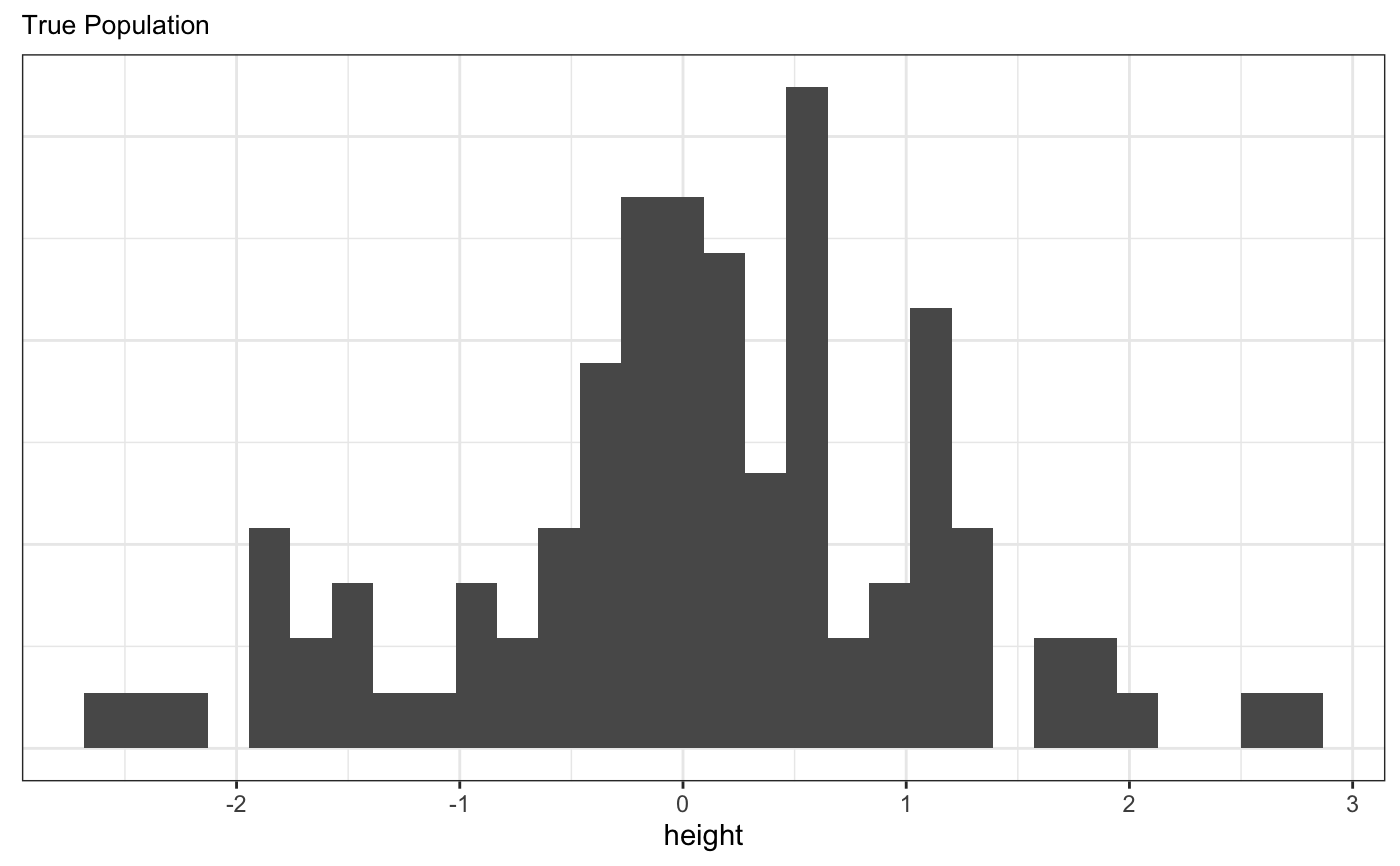
Examples
pop <- generate_virtual_pop(100, height, rnorm, 0, 1) samples <- draw_samples(pop, 3, c(1, 10)) create_sample_histograms(pop, samples, height, c(1, 10))#> [[1]]#>#> #> [[2]]#>#> #> [[3]]#>#>