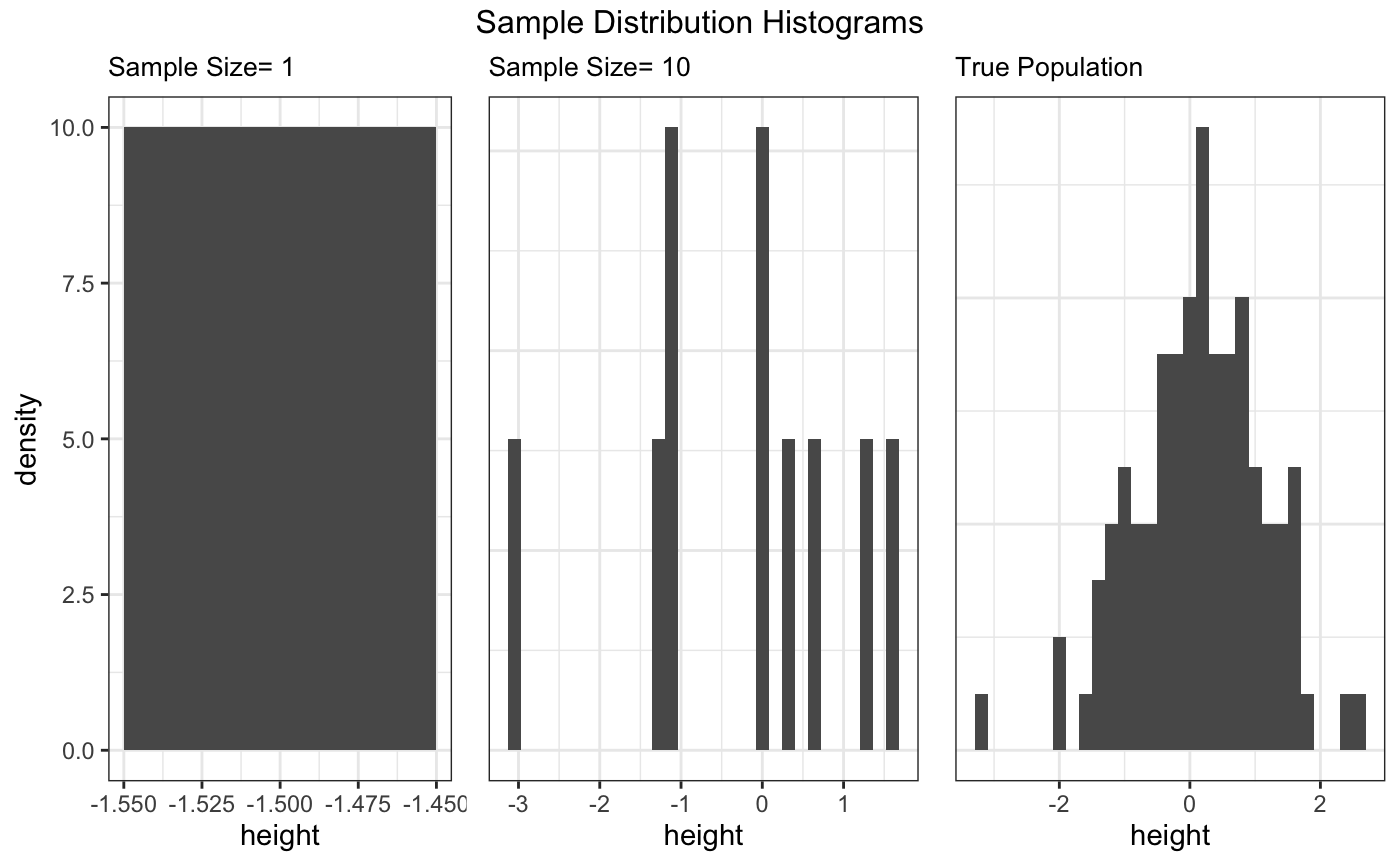
This function creates a grid of sample distributions from a population for different sample sizes.
The plotted sample is the first replication from the samples (rep == 1). The other replicates
are used for plotting the sampling distribution (applying the plot_sampling_hist function).
plot_sample_hist(pop, samples, var_name, sample_size)
Arguments
| pop | the virtual population as a tibble |
|---|---|
| samples | the samples as a tibble |
| var_name | the name of the column for the variable that is being generated |
| sample_size | a vector of the sample sizes |
Value
a list of the sample histogram plots
Examples
pop <- generate_virtual_pop(100, height, rnorm, 0, 1) samples <- draw_samples(pop, 3, c(1, 10)) plot_sample_hist(pop, samples, height, c(1, 10))#>#>#>