Detect Outliers
detect_outliers.RdDetect outliers in the given list Returns a threshold value for the lower bound and upper bound of the outliers and Plot a violin plot of the observations
Arguments
- s
list of double that contains the data
- width
The width of ggplot. Default set to 150
- height
The height of ggplot. Default set to 150
Value
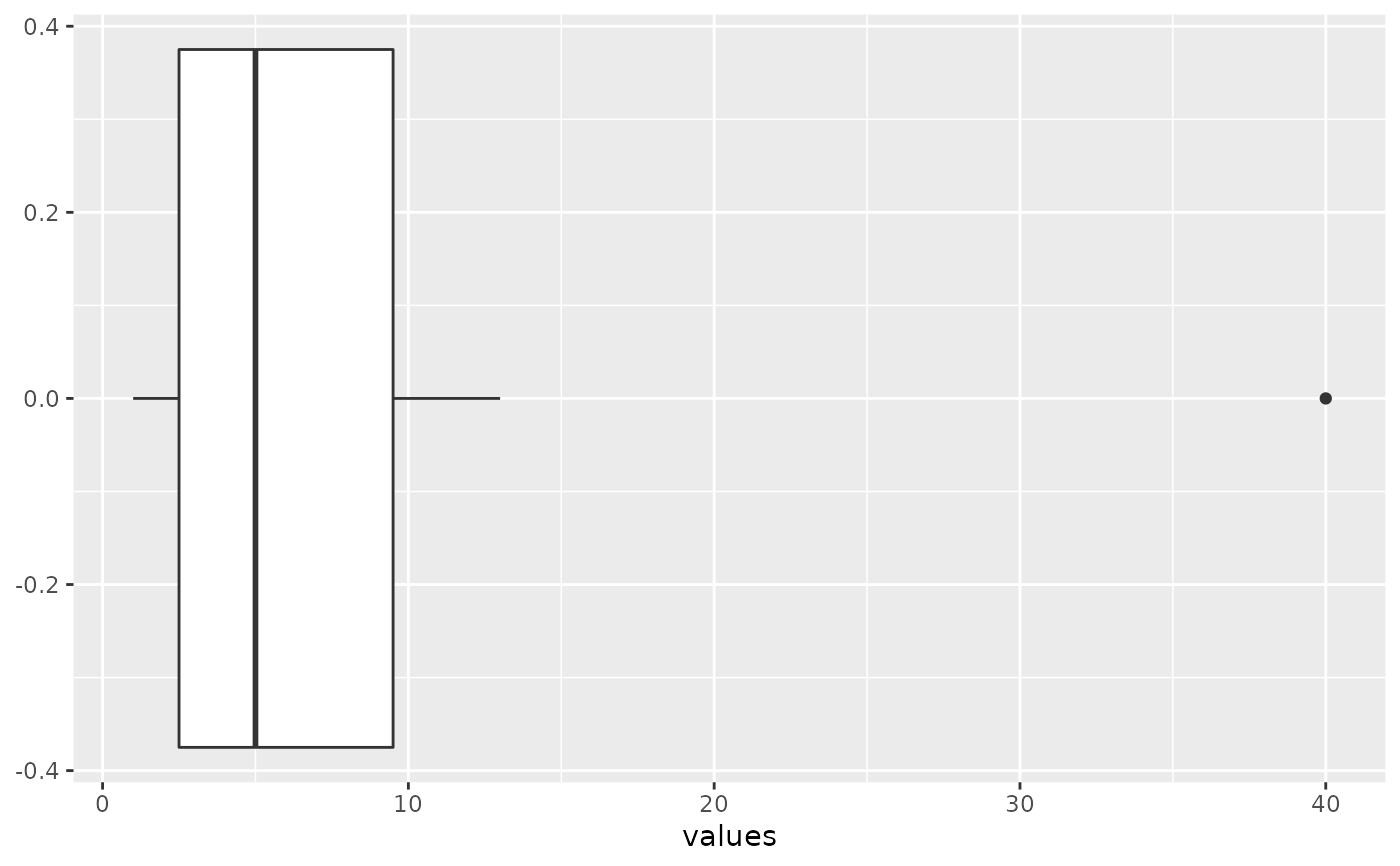
List of double A Threshold value for the lower bound and upper bound of the outliers ggplot object A Boxplot of the given values and outliers
Examples
detect_outliers(c(1,1,2,3,4,5,6,9,10,13,40), 150, 150)
#> [[1]]
#> [1] -8
#>
#> [[2]]
#> [1] 20
#>
#> [[3]]

#>
#>