Plot Correlation Matrix
plot_corr.RdA function that generates a pearson correlation plot for a list of numeric features in a given data frame.
Arguments
- df
The input data frame for plotting.
- features
A vector of characters that represents the features names. By default, NULL (returns the correlation plot of all numeric features).
Value
ggplot object, a correlation plot that illustrates the correlation between numeric features interactively.
Examples
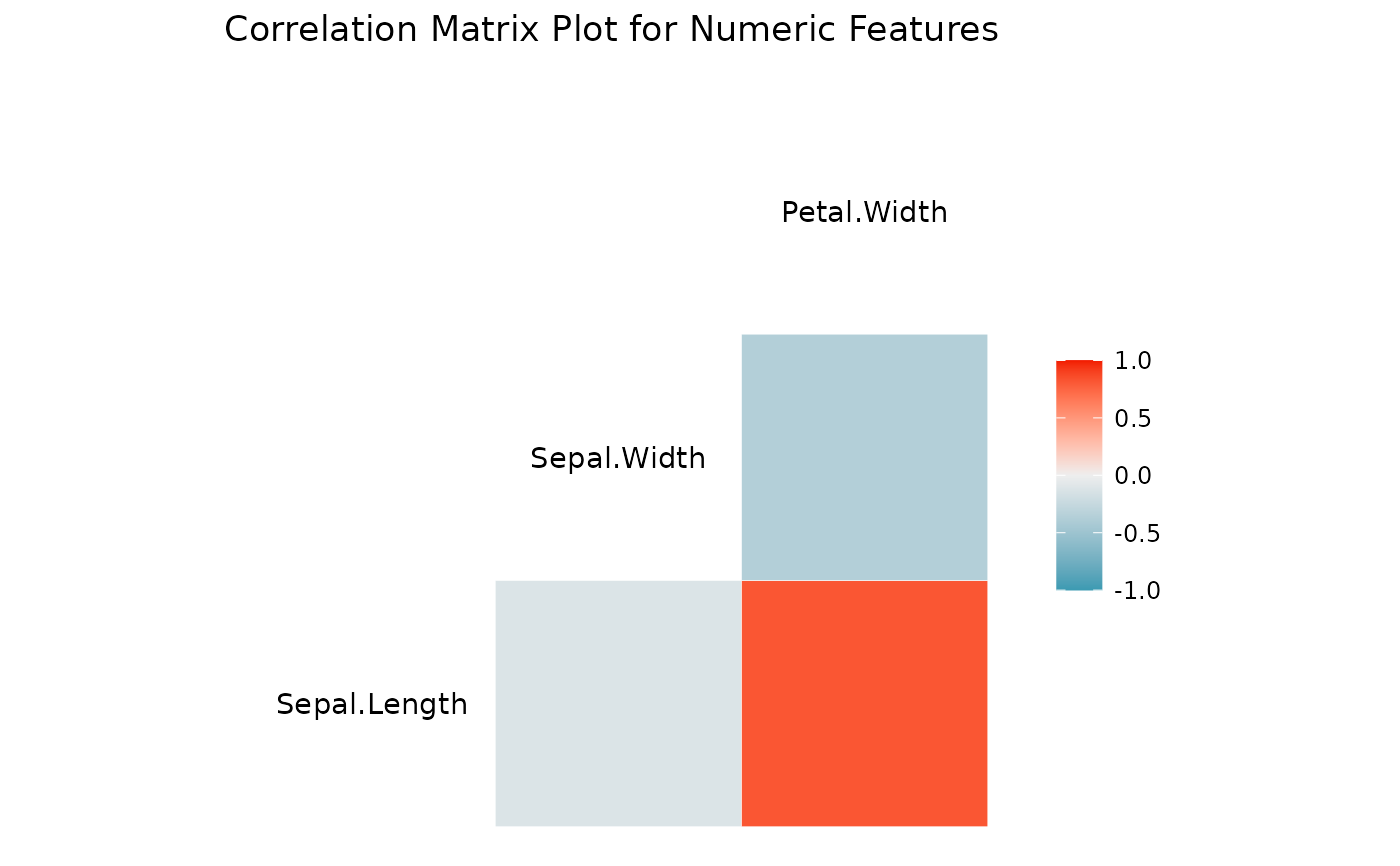
numerical_features <- c('Sepal.Length','Sepal.Width','Petal.Width')

plot_corr(iris, features = numerical_features)
#> Registered S3 method overwritten by 'GGally':
#>   method from
#>   +.gg   ggplot2