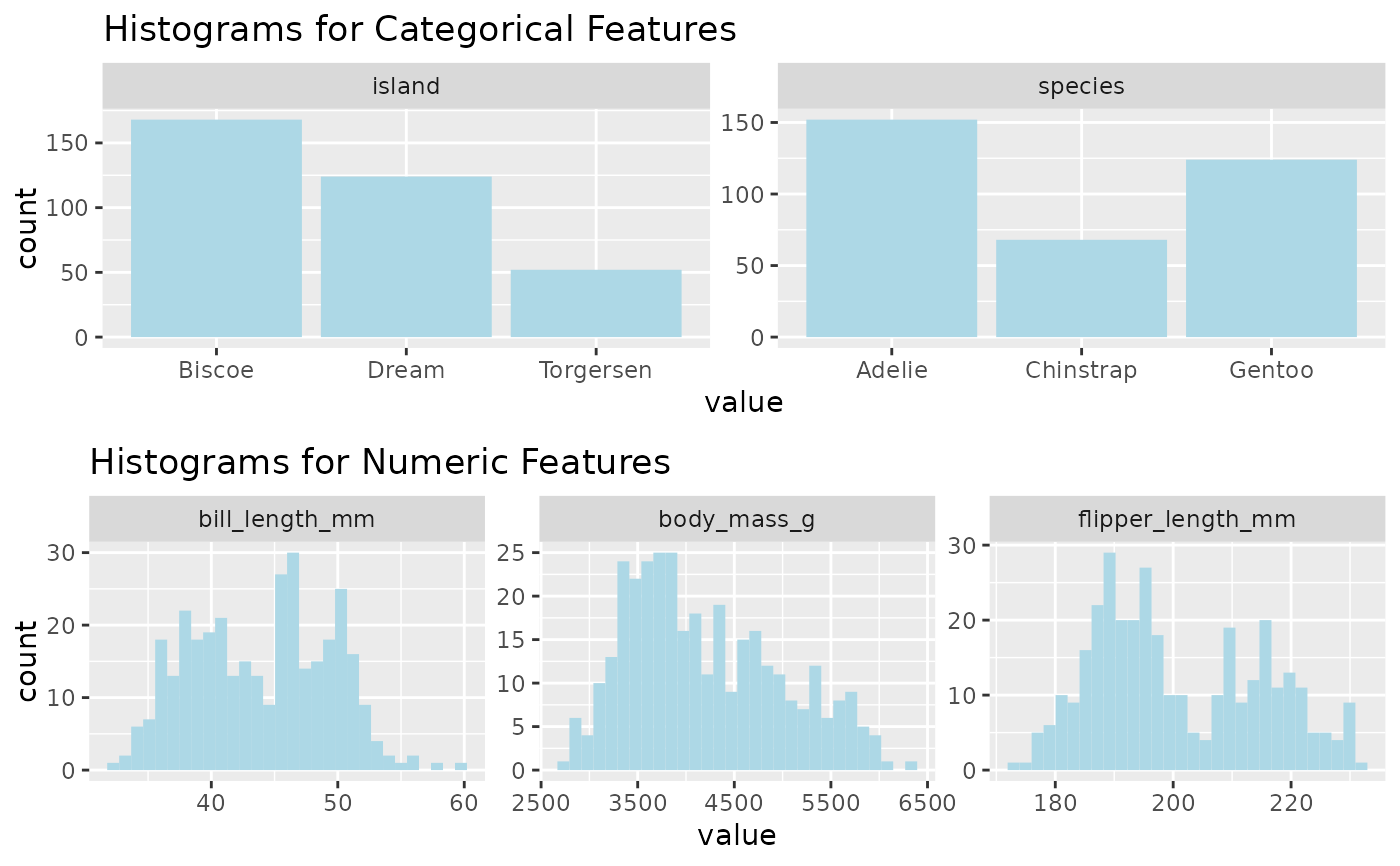
Plot Histograms
plot_histograms.RdDetect outliers in the given list. Plots histogram given numeric features of the input dfframe, and plots bar charts for categorical features of the input dfframe
Arguments
- df
dfFrame that to be used for the plot
- features
List of string feature names
- facet_columns
Number of columns in Integer type for facet options
Examples
library(palmerpenguins)
df <- penguins
plot_histograms(df, c("species", "flipper_length_mm", "bill_length_mm", "body_mass_g", "island"), 3)
#> Warning: Removed 6 rows containing non-finite values (stat_bin).