Introduction to CryptocurrencyEDAr
CryptocurrencyEDAr-vignette.Rmd
library(CryptocurrencyEDAr)Brief Introduction
CryptocurrencyEDAr is used for simple exploratory data analysis of historical cryptocurrency prices and performance.There are four functions that are included in this R package which are described in more detail below. Cryptocurrency investors and enthusiasts can use this package to analyze cryptocurrencies of interest.
Function Demonstration
Retrieve Data and Store it as a dataframe
This function downloads historical data using an an http request from a cryptocurrency exchange. It returns a data frame with cryptocurrency symbol, time frame, and closing price.
price_df <- retrieve_data("BTC-USDT", "1day", "2021-01-01", "2021-12-31")Data overview
We can take a look at the head of the data frame.
head(price_df)
#>     Symbol       Date   Close
#> 1 BTC-USDT 2021-12-30 46216.4
#> 2 BTC-USDT 2021-12-29 47122.4
#> 3 BTC-USDT 2021-12-28 46466.4
#> 4 BTC-USDT 2021-12-27 47543.8
#> 5 BTC-USDT 2021-12-26 50715.7
#> 6 BTC-USDT 2021-12-25 50771.5
Plot the price data
We can plot the price data using the data frame we just retrieved.
plot_price(df = price_df)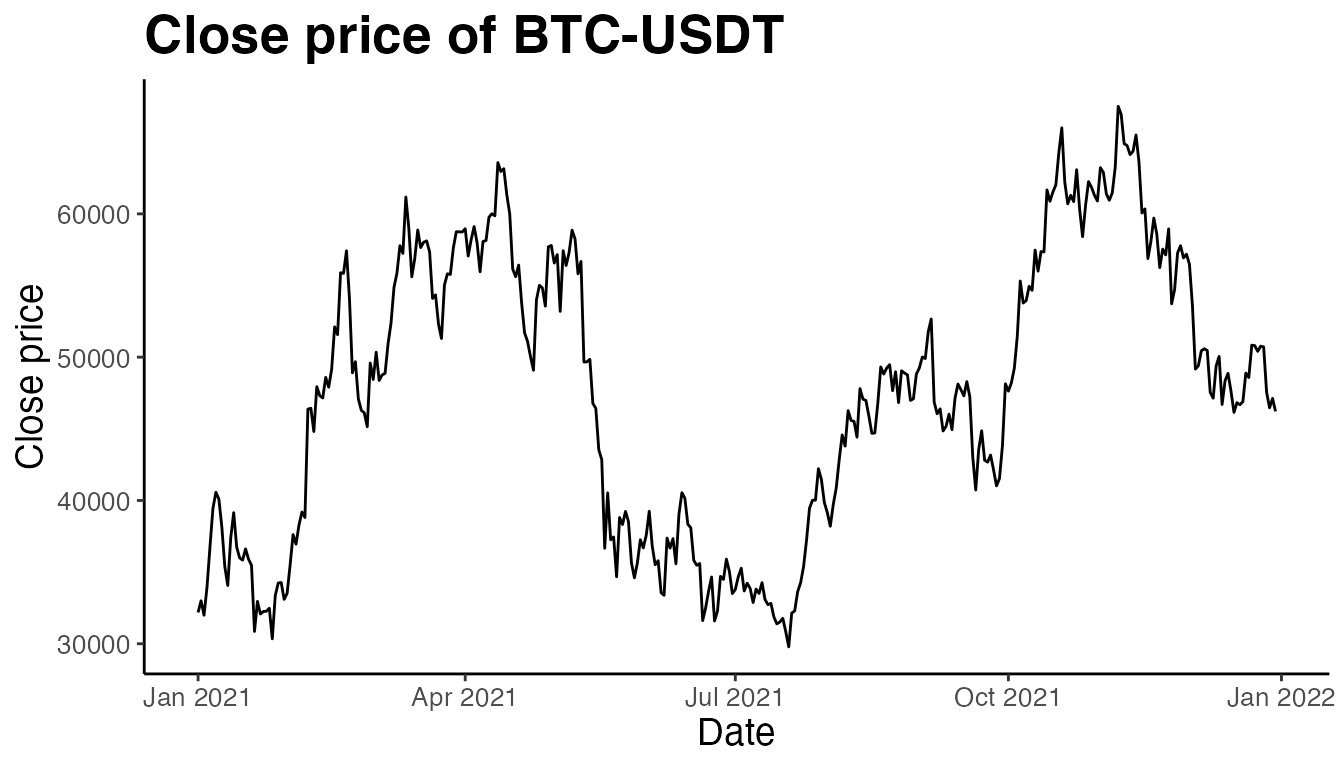
Calculate daily growth rate
This function performs calculation of daily growth rate of the price of the cryptocurrency inputted over a period of time. We store the result as a variable for the purpose of viewing the data.
new_price_df <- daily_growth_rate(price_df, "Close")
head(new_price_df)
#>     Symbol       Date   Close daily_growth_rate
#> 1 BTC-USDT 2021-12-30 46216.4                NA
#> 2 BTC-USDT 2021-12-29 47122.4         1.9603431
#> 3 BTC-USDT 2021-12-28 46466.4        -1.3921192
#> 4 BTC-USDT 2021-12-27 47543.8         2.3186647
#> 5 BTC-USDT 2021-12-26 50715.7         6.6715324
#> 6 BTC-USDT 2021-12-25 50771.5         0.1100251
Calculate average daily return
avg_daily_return(price_df$Close)
#> [1] -38.65289