Plot Cloropleth Map of Covid Data
plot_geographical.RdPlot Cloropleth Map of Covid Data
plot_geographical(covid_df, metric)Arguments
- covid_df
dataframe containing covid data to plot
- metric
unquoted column name of a quantitative variable to plot
Value
plot object of cloropleth map
Examples
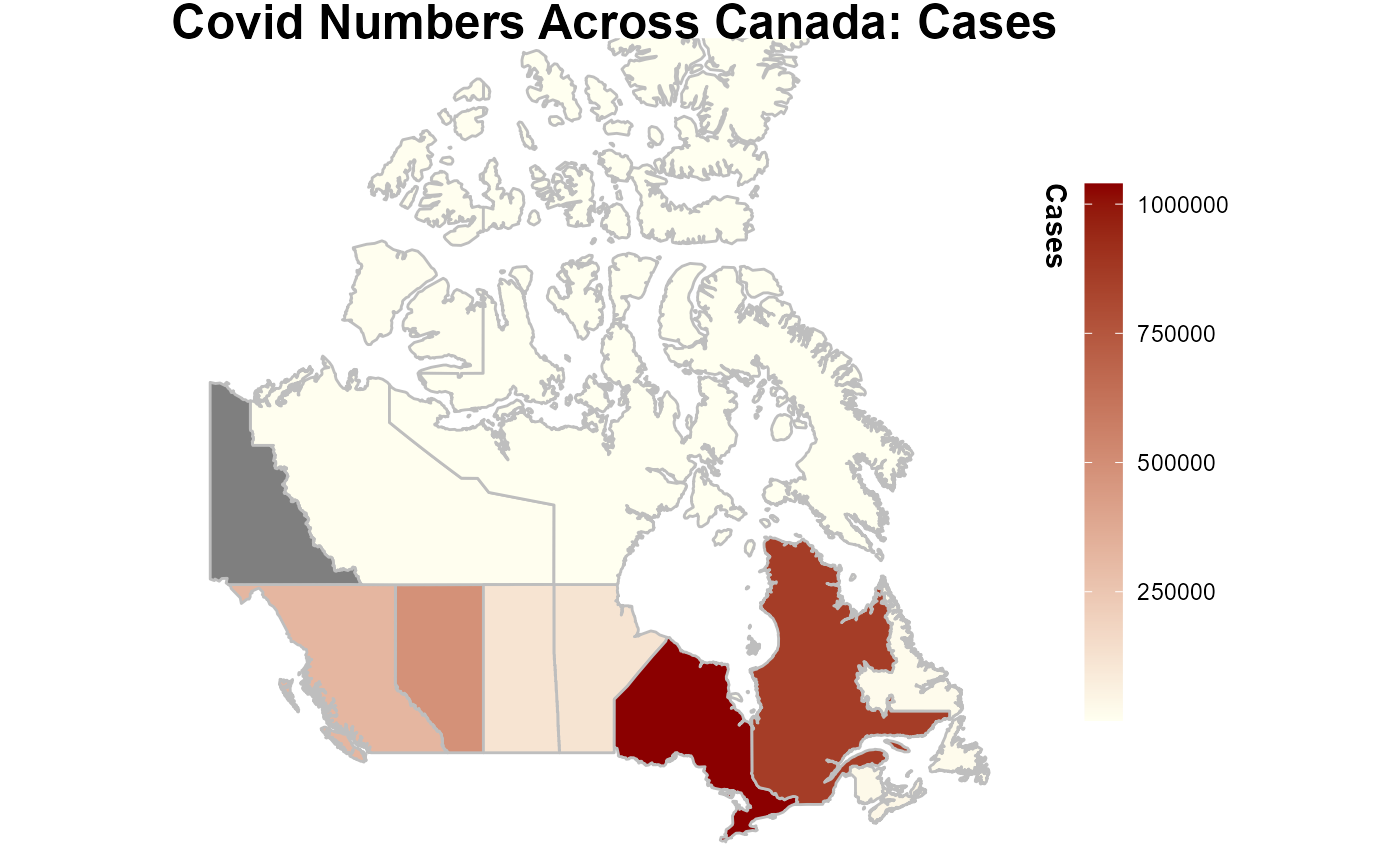
covid_df <- get_covid_data()
plot_geographical(covid_df, cases)
#> Registered S3 method overwritten by 'geojsonsf':
#>   method        from
#>   print.geojson geojson
#> Warning: Using `as.character()` on a quosure is deprecated as of rlang 0.3.0.
#> Please use `as_label()` or `as_name()` instead.
#> This warning is displayed once per session.