CovidTracker-R Vignette
CovidTracker-R.RmdIntroduction to CovidTrackerR
CovidTrackerR is a R package for basic data cleaning, wrangling and plotting of Covid tracking data in Canada. The package will allow you to pull data from the opencovid.ca API, visualize Covid related trends as a timeseries or a map, and calculate summary statistics of the Covid data.
Installation
To use this package, follow the installation guide on README and install this package. Then, import the package.
library(CovidTrackerR)
#> Loading required package: tidyverse
#> -- Attaching packages --------------------------------------- tidyverse 1.3.1 --
#> v ggplot2 3.3.5     v purrr   0.3.4
#> v tibble  3.1.4     v dplyr   1.0.7
#> v tidyr   1.1.3     v stringr 1.4.0
#> v readr   2.0.2     v forcats 0.5.1
#> -- Conflicts ------------------------------------------ tidyverse_conflicts() --
#> x dplyr::filter() masks stats::filter()
#> x dplyr::lag()    masks stats::lag()
Functions
Retrieve data using get_covid_data:
- This function acquires Canada Covid data of a specified type and for an optionally provided date and province
- If no arguments are given, the default is that the function will return cases data for all provinces and all dates.
- An example of when provinces and dates are provided and omitted are shown below.
covid_data_spec <- get_covid_data('active', 'BC', '13-01-2021')
covid_data_spec
#>   active_cases active_cases_change cumulative_cases cumulative_deaths
#> 1         6148                -242            59072              1031
#>   cumulative_recovered date_active province
#> 1                51893  13-01-2021       BC
covid_data <- get_covid_data()
head(covid_data)
#>   cases cumulative_cases date_report province
#> 1     0                0  25-01-2020  Alberta
#> 2     0                0  26-01-2020  Alberta
#> 3     0                0  27-01-2020  Alberta
#> 4     0                0  28-01-2020  Alberta
#> 5     0                0  29-01-2020  Alberta
#> 6     0                0  30-01-2020  Alberta
Geographical visualization with plot_geographical:
- This function creates and plots a cloropleth map of the specified Covid tracking metric per province
covid_df <- CovidTrackerR::get_covid_data()
plot_geographical(covid_df, cases)
#> Registered S3 method overwritten by 'geojsonsf':
#>   method        from
#>   print.geojson geojson
#> Warning: Using `as.character()` on a quosure is deprecated as of rlang 0.3.0.
#> Please use `as_label()` or `as_name()` instead.
#> This warning is displayed once per session.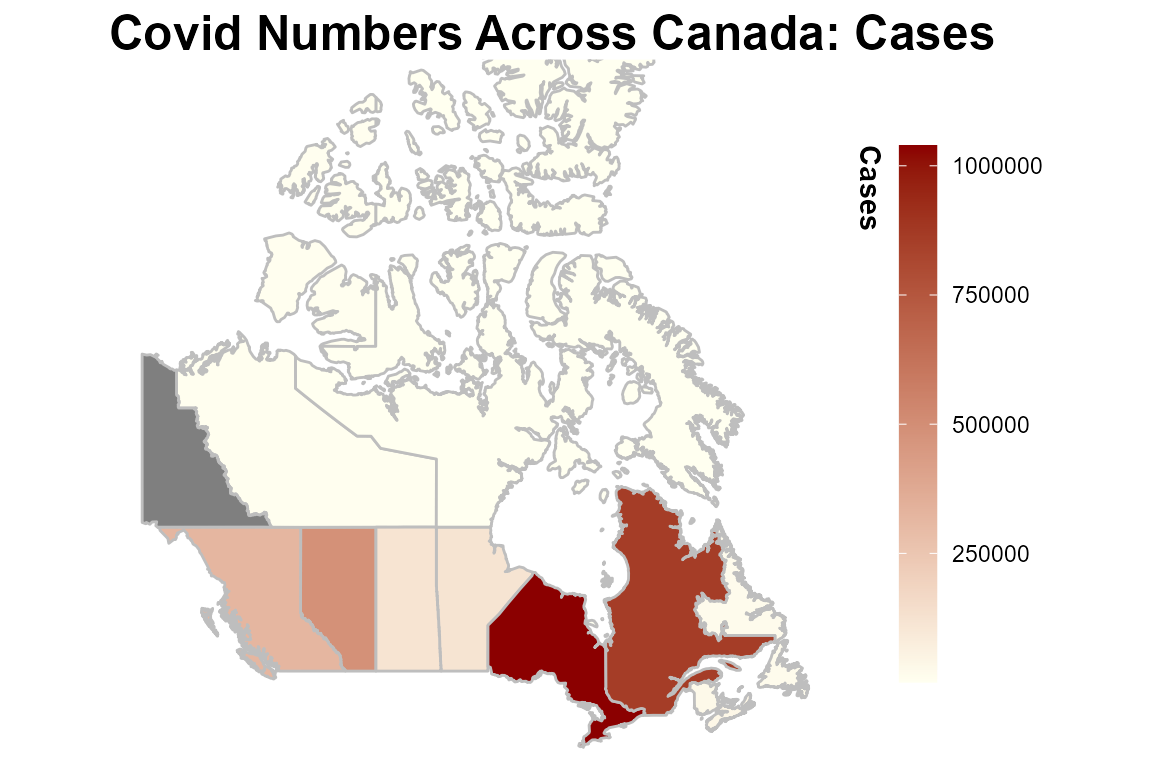
Time series visualization with plot_timeseries:
- This function creates a plot of a specified covid metric over time.
- Start and end dates can be optionally specified by user, if dates are not provided, function will create a plot over all dates in dataframe.
df <- get_covid_data()
plot_timeseries(df,cases)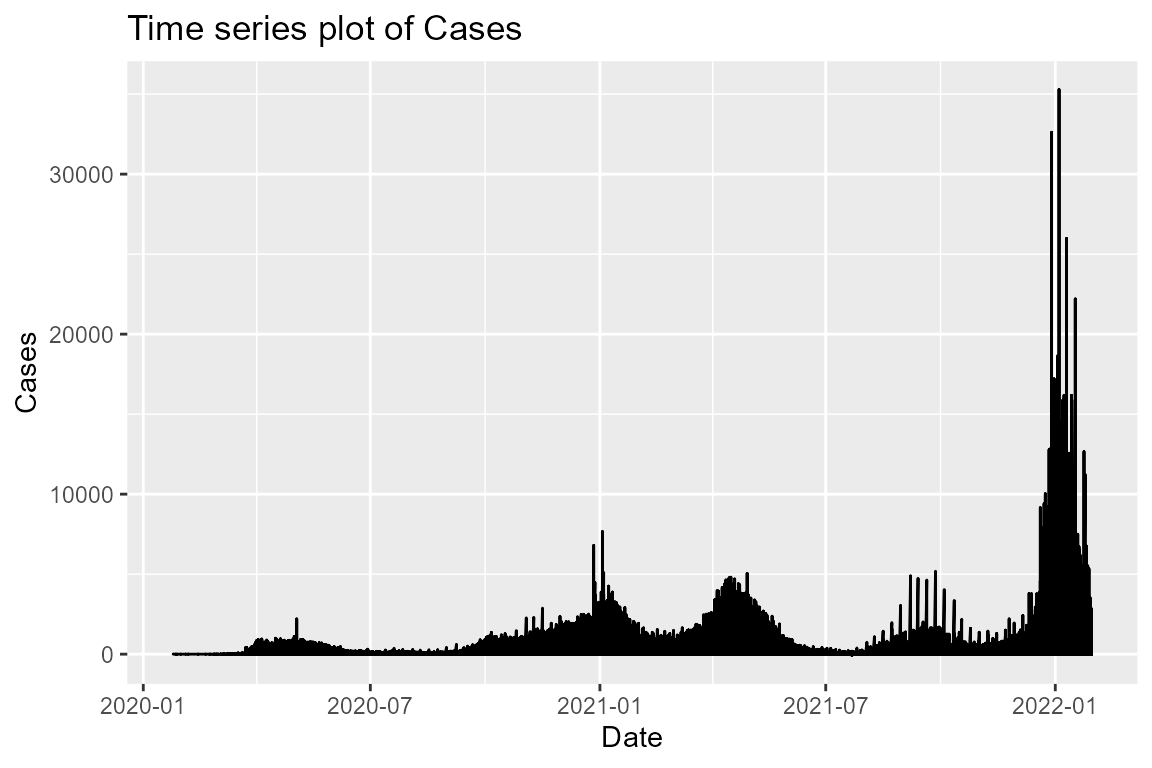
Calculate statistical summaries with calculate_stat_summary:
- This function provides summary information about a specified Covid metric in each province of Canada. It returns a dataframe containing statistical summaries such as the min, max, mean, and quartiles.
covid_df <- get_covid_data()
calculate_stat_summary(covid_df,'cases')
#>         province start_date   end_date count      sd min   max mean quantile_25
#> 1        Alberta 2020-01-25 2022-01-30   737 1349.10   0 17577  661          18
#> 2             BC 2020-01-25 2022-01-30   737  807.77   0  9332  434           0
#> 3       Manitoba 2020-01-25 2022-01-30   737  436.47   0  7083  161           1
#> 4  New Brunswick 2020-01-25 2022-01-30   737  137.24  -2  2548   38           0
#> 5             NL 2020-01-25 2022-01-30   737  129.75   0  1873   22           0
#> 6    Nova Scotia 2020-01-25 2022-01-30   737  157.65  -1  1184   51           0
#> 7        Nunavut 2020-01-25 2022-01-30   737   10.14   0   140    2           0
#> 8            NWT 2020-01-25 2022-01-30   737   31.58  -4   314    7           0
#> 9        Ontario 2020-01-25 2022-01-30   737 2901.28   0 35287 1409         202
#> 10           PEI 2020-01-25 2022-01-30   737   46.69   0   407   10           0
#> 11        Quebec 2020-01-25 2022-01-30   737 2329.72 -90 17122 1166         158
#> 12   Repatriated 2020-01-25 2022-01-30   737    0.20   0     4    0           0
#> 13  Saskatchewan 2020-01-25 2022-01-30   737  251.78   0  1979  159           8
#> 14         Yukon 2020-01-25 2022-01-30   737   16.12   0   197    4           0
#>    quantile_50 quantile_75 current_value
#> 1          206         773             0
#> 2           72         580             0
#> 3           52         170             0
#> 4            3          16           274
#> 5            0           3             0
#> 6            2          17           425
#> 7            0           0           122
#> 8            0           0             0
#> 9          548        1549          1103
#> 10           0           1             0
#> 11         650        1093          2838
#> 12           0           0             0
#> 13          71         220          1347
#> 14           0           1             0