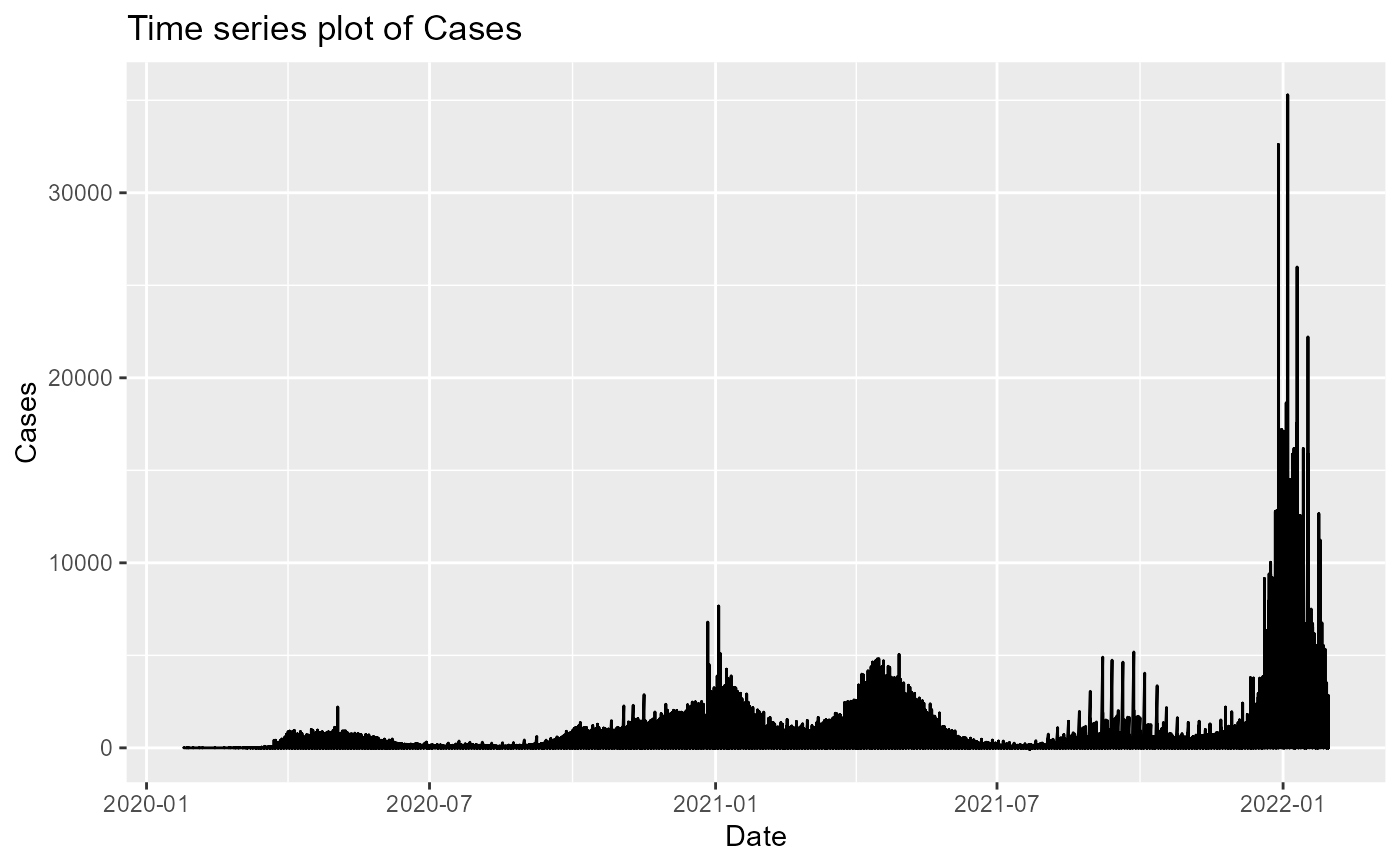
Create a plot of the number of covid cases over time.
plot_timeseries.RdCreate a plot of the number of covid cases over time.
plot_timeseries(covid_df, metric, start = "", end = "")Arguments
- covid_df
a dataframe containing covid data to plot
- metric
the name of column from covid data to plot along time
- start
a string indicating the start date in pattern YYYY-MM-DD
- end
a string indicating the end date in pattern YYYY-MM-DD
Value
plot object
Examples
df <- get_covid_data()
plot_timeseries(df,cases)