KmeansR-vignette
KmeansR-vignette.Rmdlibrary(Kmeans)
#>
#> Attaching package: 'Kmeans'
#> The following object is masked from 'package:stats':
#>
#> predict
library(tidyverse)
#> ── Attaching packages ───────────────────────────────────────────────────────────────────────────────────────────────────────────────────────────────────────────────────────────────────────────────────────────────────────────────────────── tidyverse 1.2.1 ──
#> ✓ ggplot2 3.2.1 ✓ purrr 0.3.3
#> ✓ tibble 2.1.3 ✓ dplyr 0.8.3
#> ✓ tidyr 1.0.0 ✓ stringr 1.4.0
#> ✓ readr 1.3.1 ✓ forcats 0.4.0
#> ── Conflicts ──────────────────────────────────────────────────────────────────────────────────────────────────────────────────────────────────────────────────────────────────────────────────────────────────────────────────────────── tidyverse_conflicts() ──
#> x dplyr::filter() masks stats::filter()
#> x dplyr::lag() masks stats::lag()Introduction to the Kmeans Package
This document introduces you to the Kmeans package. This is different from the Kmeans package available in base R. This package is created as a part of a course project to learn the fundamentals of collborative software development. This package implements the K-Means algorith for clustering. This will work on any dataset with valid numerical features, and includes fit, predict, and cluster_summary functions, as well as as elbow and silhouette methods for hyperparameter “k” optimization
Data
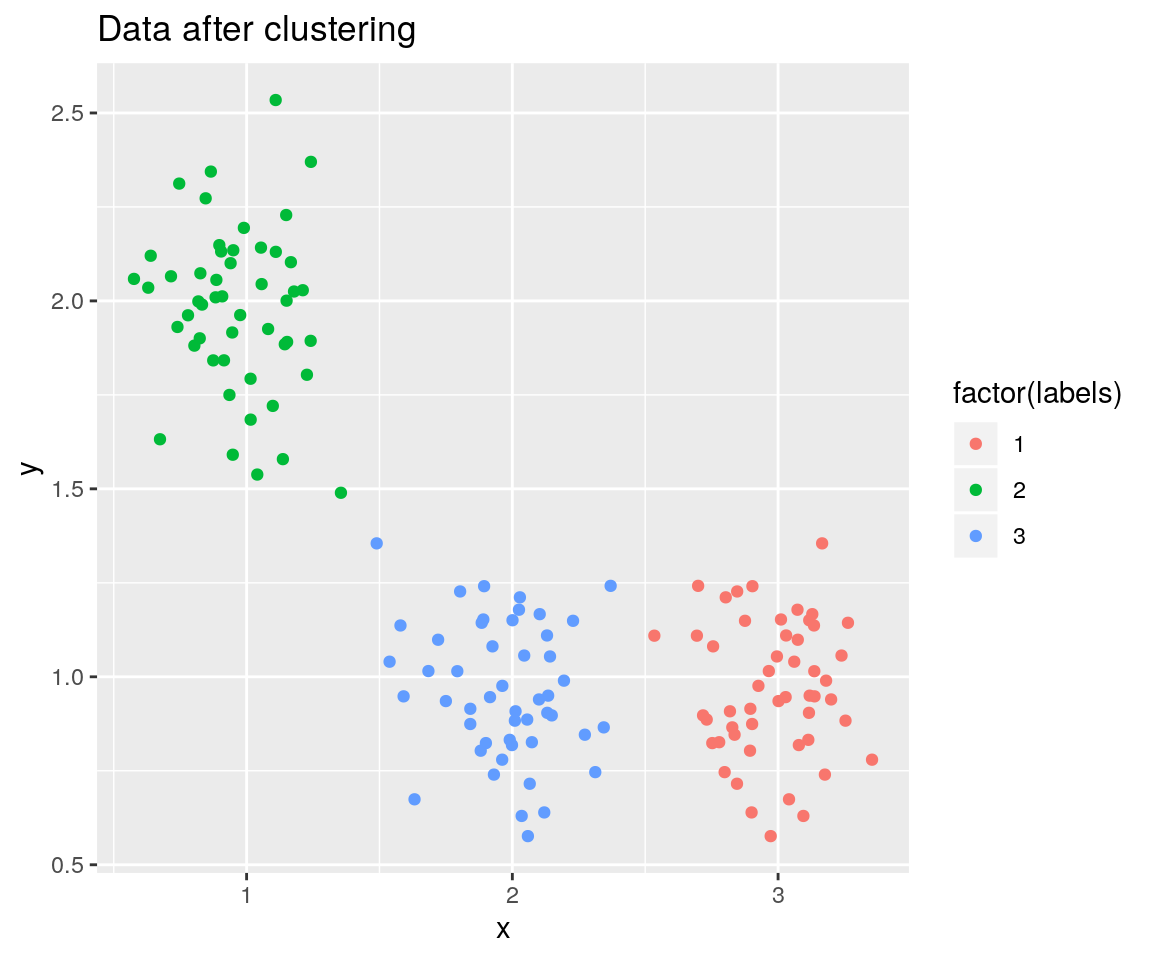
To explore the Kmeans package, we will use a randomly generated dataset having 3 clustesr. Let’s explore how to cluster this dataset using the Kmeans package.
Fit the data set using fit()
Let’s fit using the data to get the labels and centers.
km <- fit(X_train, k = 3)
labels <- km$labels
centers <- km$centers
print("Cluster centers are: ")
#> [1] "Cluster centers are: "
centers
#>           x         y
#> 1 2.9803755 0.9668848
#> 2 0.9640346 1.9814926
#> 3 1.9702088 0.9610680
print("Labels are : ")
#> [1] "Labels are : "
labels
#>   [1] 2 2 2 2 2 2 2 2 2 2 2 2 2 2 2 2 2 2 2 2 2 2 2 2 2 2 2 2 2 2 2 2 2 2 2 2 2
#>  [38] 2 2 2 2 2 2 2 2 2 2 2 2 2 3 3 3 3 3 3 1 3 3 3 3 3 3 3 3 3 3 3 3 3 3 3 3 3
#>  [75] 3 3 3 3 3 3 3 3 3 3 3 3 3 3 3 3 3 3 3 3 3 3 3 3 3 3 1 1 1 1 1 1 1 1 1 1 1
#> [112] 1 1 1 1 1 1 1 1 1 1 1 1 1 1 1 1 1 1 1 1 1 1 1 1 1 1 1 1 1 1 1 1 1 1 1 1 1
#> [149] 1 1

# Plot the clusters
df_results <- X_train
df_results$labels <- labels

ggplot(df_results, aes(x=x, y=y, color=factor(labels))) +
    geom_point() +
    ggtitle("Data after clustering")
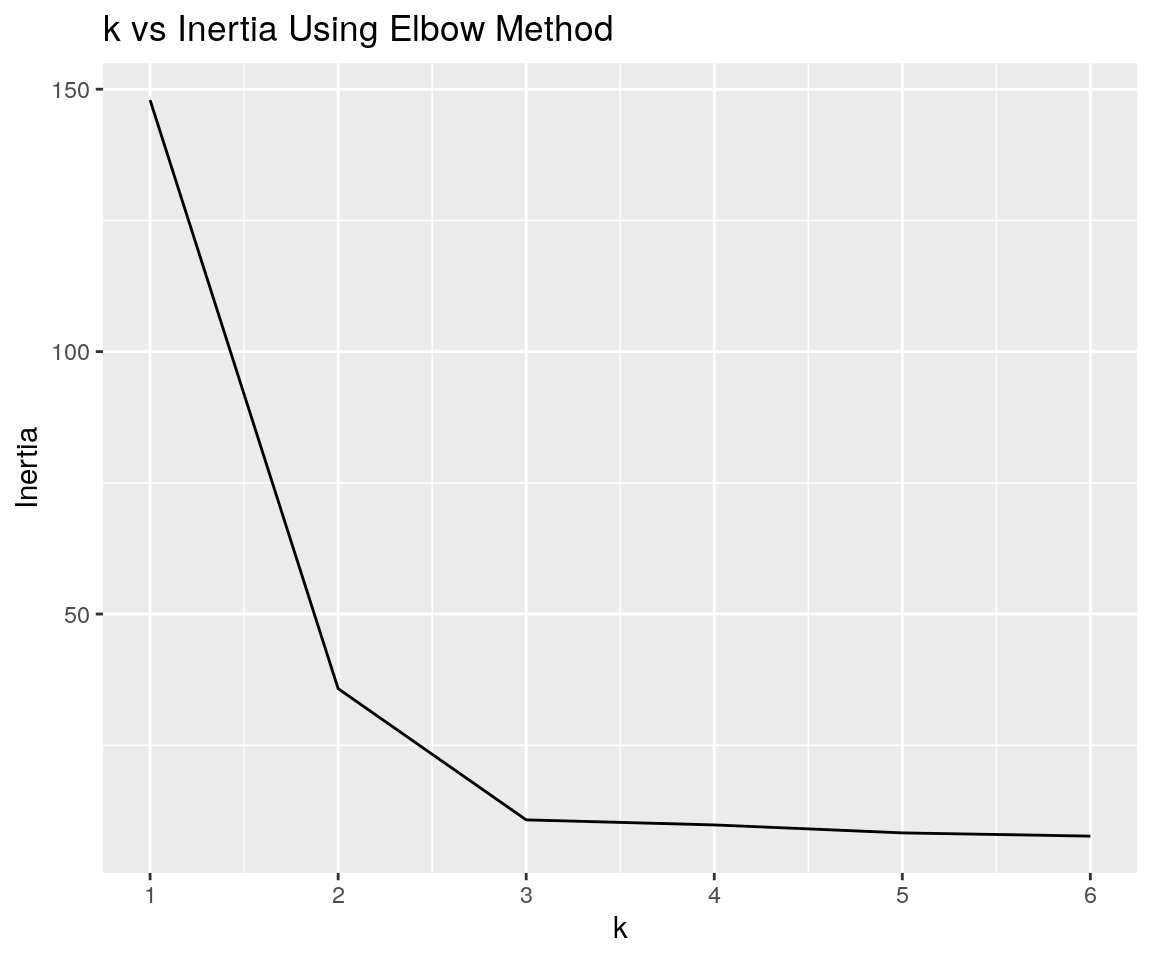
Evaluate different number of clusters sing elbow() function
centers <- c( 1, 2, 3, 4, 5, 6)
el <- elbow(X_train, centers)
inertia <- el$inertia
plot <- el$plot
plot
The inertia plot has a sharp bend at k=3 suggesting the optimal number of clusters in our dataset it 3.
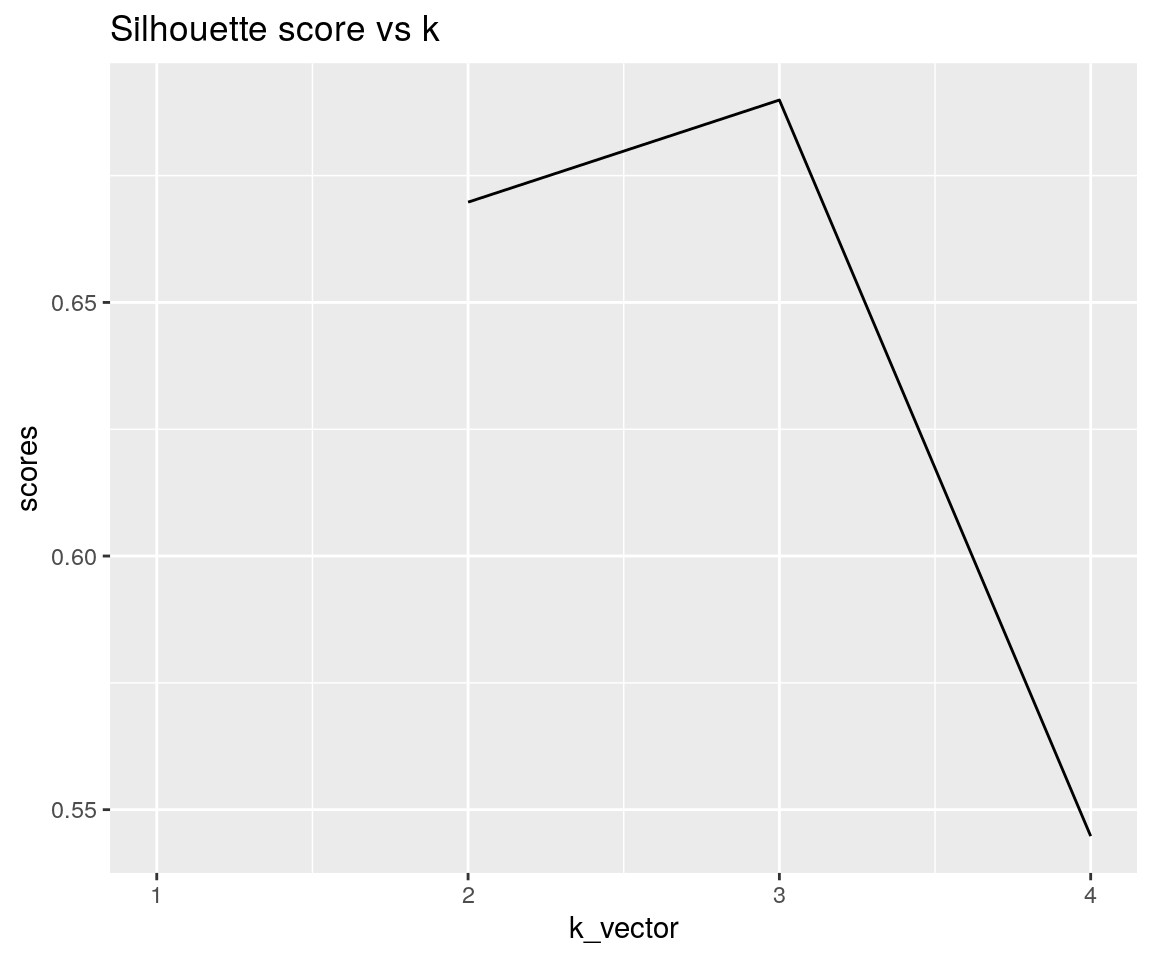
Evaluate different number of clusters using silhouette() function
centers <- c( 1, 2, 3, 4)
sl <- silhouette(X_train, centers)
scores <- sl$scores
plot <- sl$plot
plot
#> Warning: Removed 1 rows containing missing values (geom_path).
As we can see, the silhouette score is the highest at k = 3, which is the optimal number of clusters in out dataset.