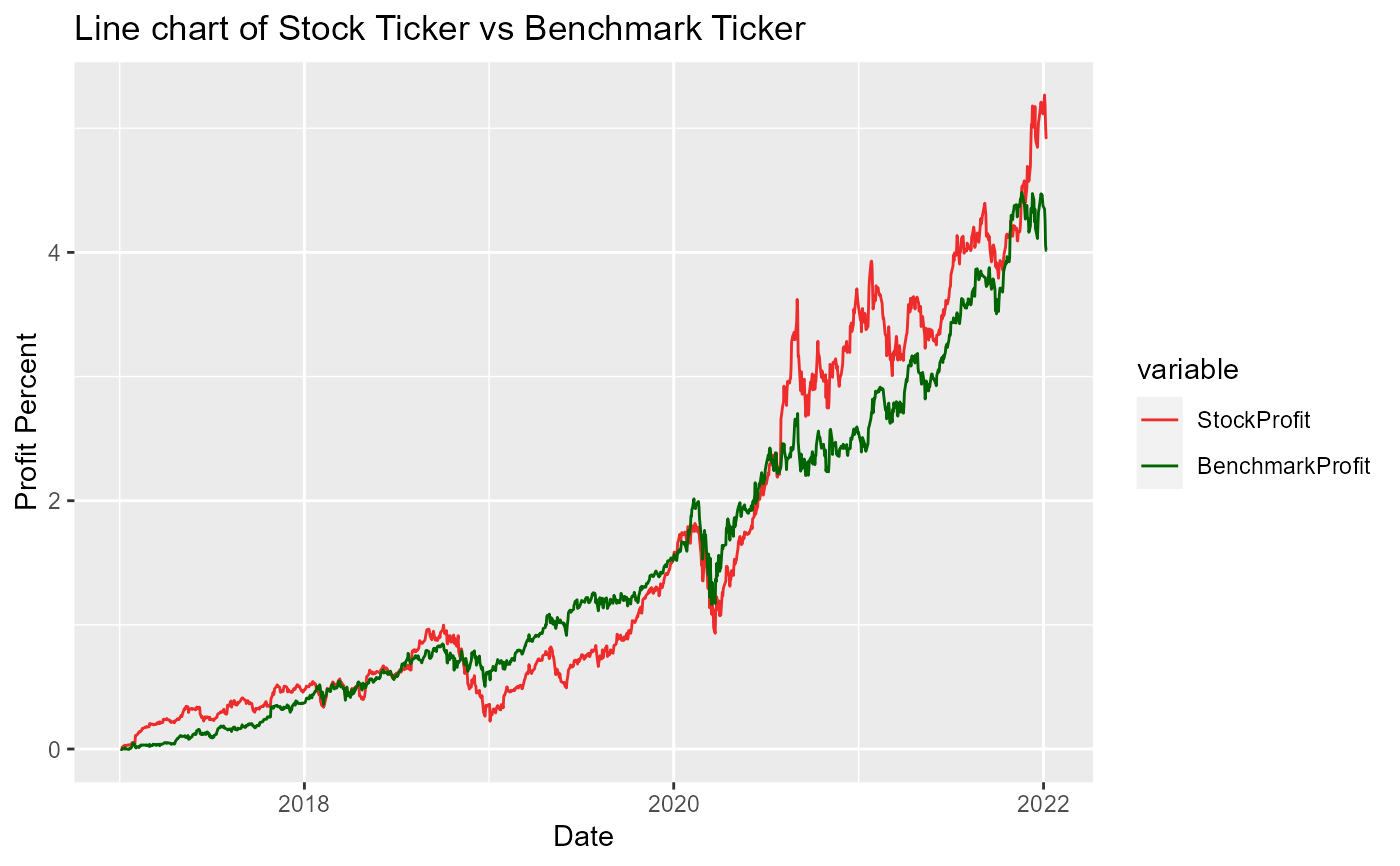
Visualizes trend of a stock price change against the market benchmark within a given period of time
profit_viz.RdVisualizes trend of a stock price change against the market benchmark within a given period of time
Arguments
- stock_ticker
A string related to ticker of the stock or ETF, such as "AAPL"
- start_date
A date in string format of "YYYY-MM-DD" related to start of data extraction
- end_date
A date in string format of "YYYY-MM-DD" related to end of data extraction
- benchmark_ticker
A string Benchmark Ticker of the stock such as 'SPY'