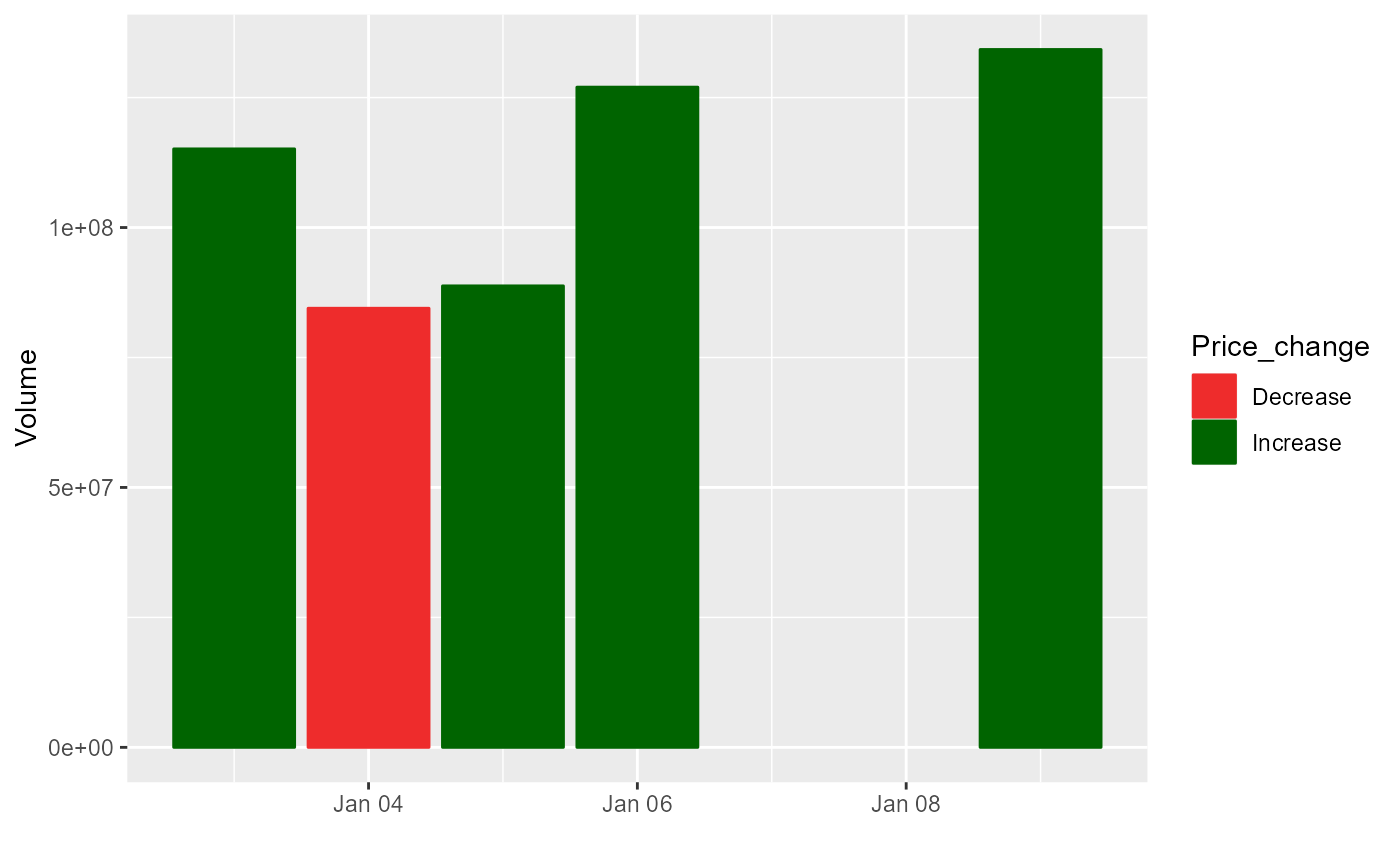
Visualizes the daily trading volume of a stock using bar plot within a given period of time
volume_viz.RdVisualizes the daily trading volume of a stock using bar plot within a given period of time
volume_viz.RdVisualizes the daily trading volume of a stock using bar plot within a given period of time