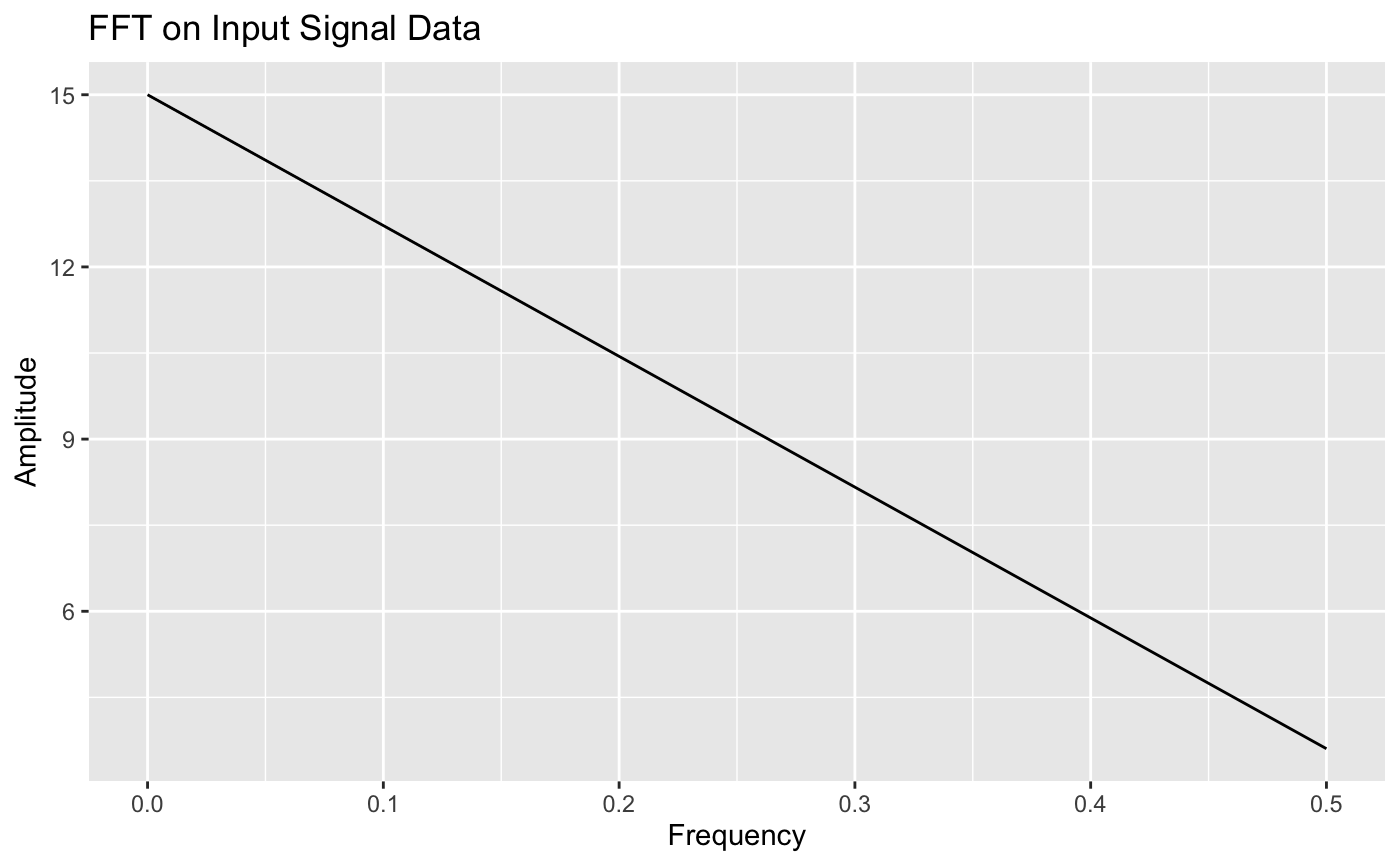
Creates a Fourier transform plot of the data specified in the 'data_col' column using ggplot2
Source:R/fourier_transform.R
fourier_transform.RdCreates a Fourier transform plot of the data specified in the 'data_col' column using ggplot2
fourier_transform(data, time_col, data_col)
Arguments
| data | DataFrame containing all necessary information |
|---|---|
| time_col | string containing the time data column corresponding to the data we want to apply Fourier transform to |
| data_col | string containing the name of the column we want to apply Fourier transform to |
Value
a ggplot2 line plot of frequency vs amplitude of the data inputed
Examples
my_data = tibble::tibble(time_series =  c(0, 1, 2, 3), signal = c(2, 3, 4, 6))
fourier_transform(data = my_data,
                  time_col = "time_series",
                  data_col = "signal")
