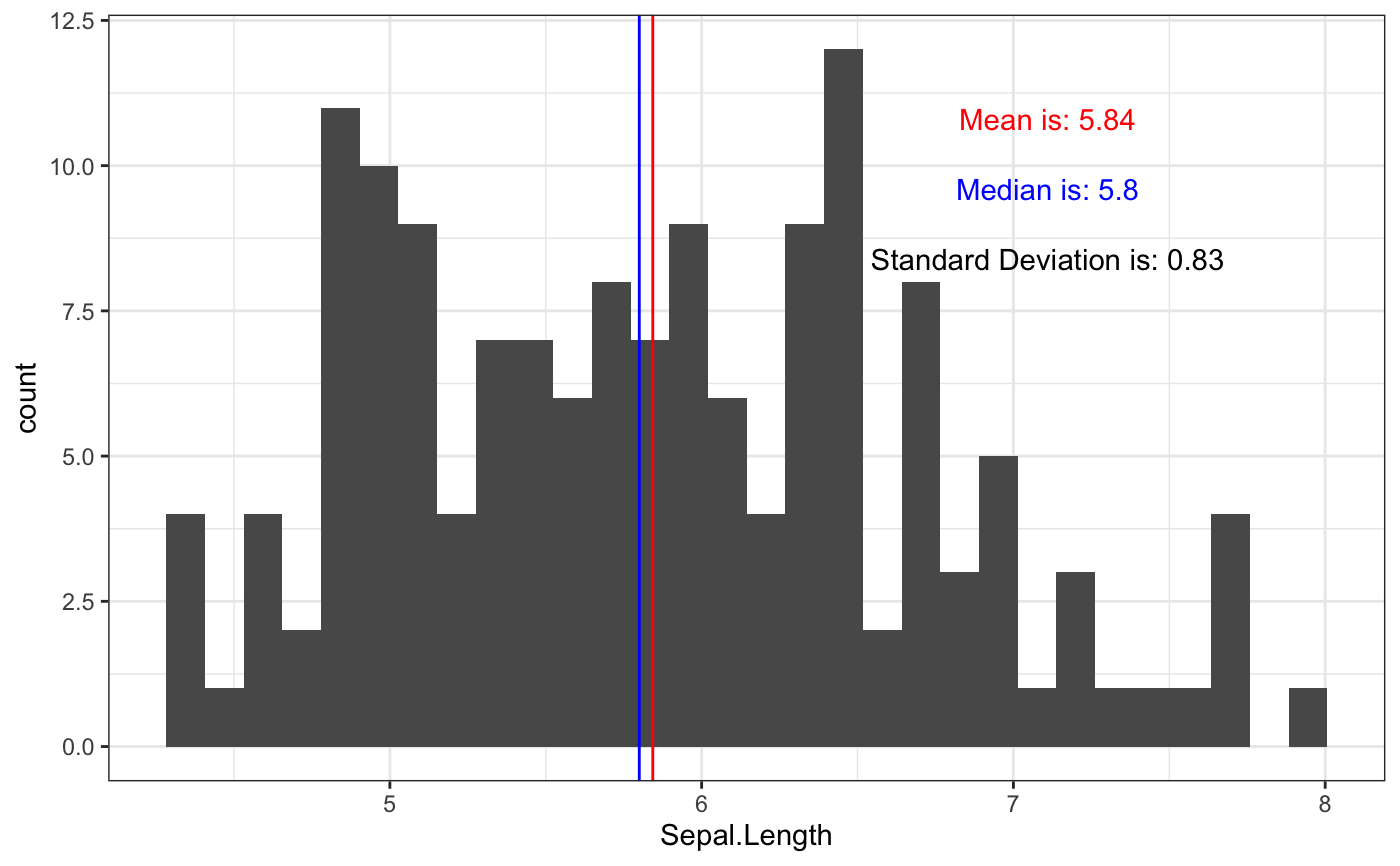
Creates a ggplot histogram that indicates the position of the mean and median and displays the standard deviation.
gghist(data, variable)
Arguments
| data | A tibble or dataframe. |
|---|---|
| variable | The column name inside data that will be made into a histogram. |
Value
Produces a ggplot histogram with mean, median and standard deviation indicated on the plot.
Examples
gghist(iris, Sepal.Length)#>#>