Create a scatterplot and calculate correlation values for two numerical variables
Source:R/ggscatter.R
scatter_express.RdCreates a ggplot scatterplot object containing two numerical variables. Arguments in the function will control whether correlational values and log transformations are calculated for the input data.
scatter_express(
  df,
  xval = NA,
  yval = NA,
  x_transform = FALSE,
  y_transform = FALSE
)
Arguments
| df | Dataframe to plot |
|---|---|
| xval | x-var Column name used as the x-axis variable |
| yval | y-var Column name used as the y-axis variable |
| x_transform | Determines whether the x-axis undergoes a natural log transformation |
| y_transform | Determines whether the y-axis undergoes a natural log transformation |
Value
ggplot Object
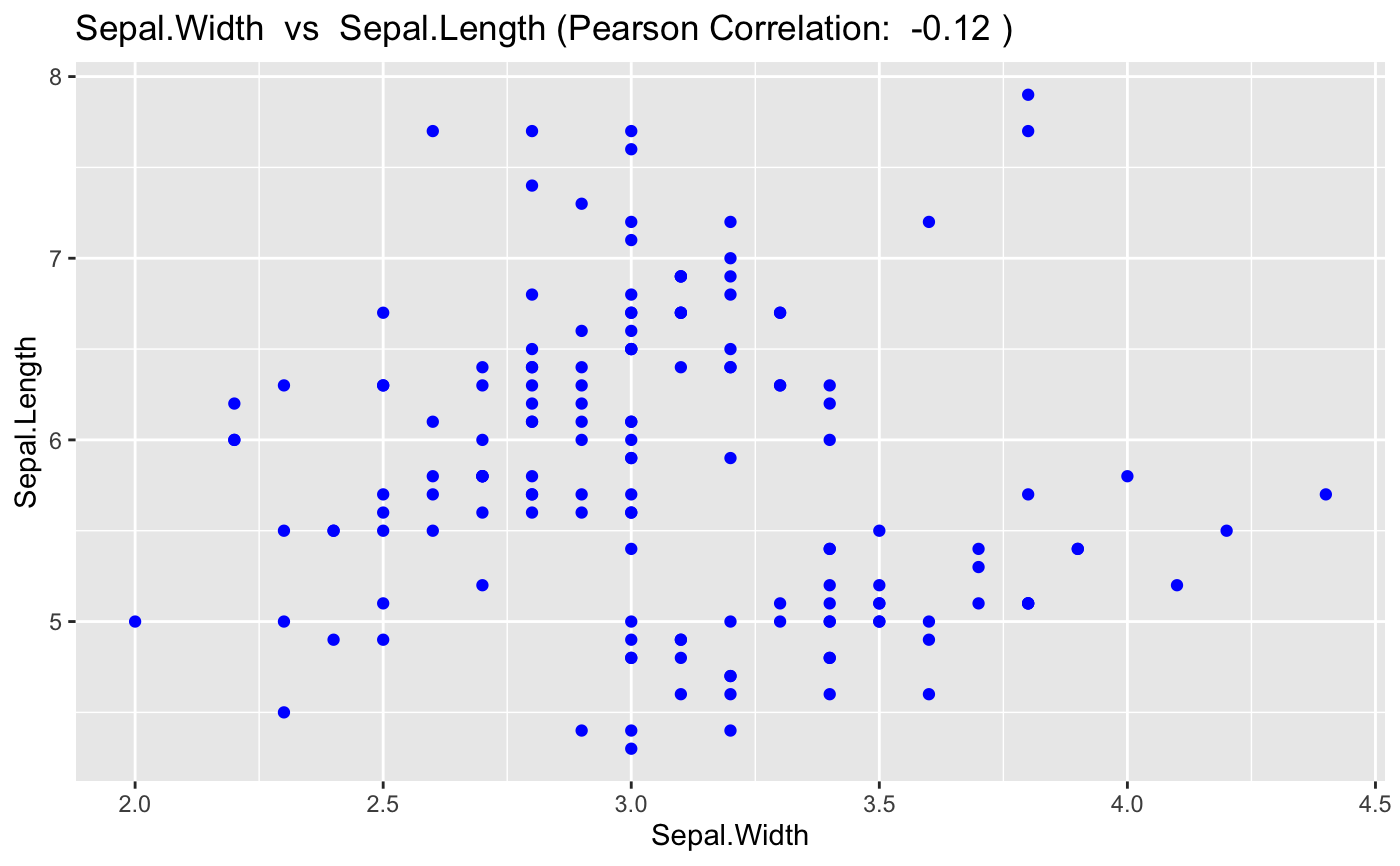
Examples
scatter_express(iris, Sepal.Width, Sepal.Length)