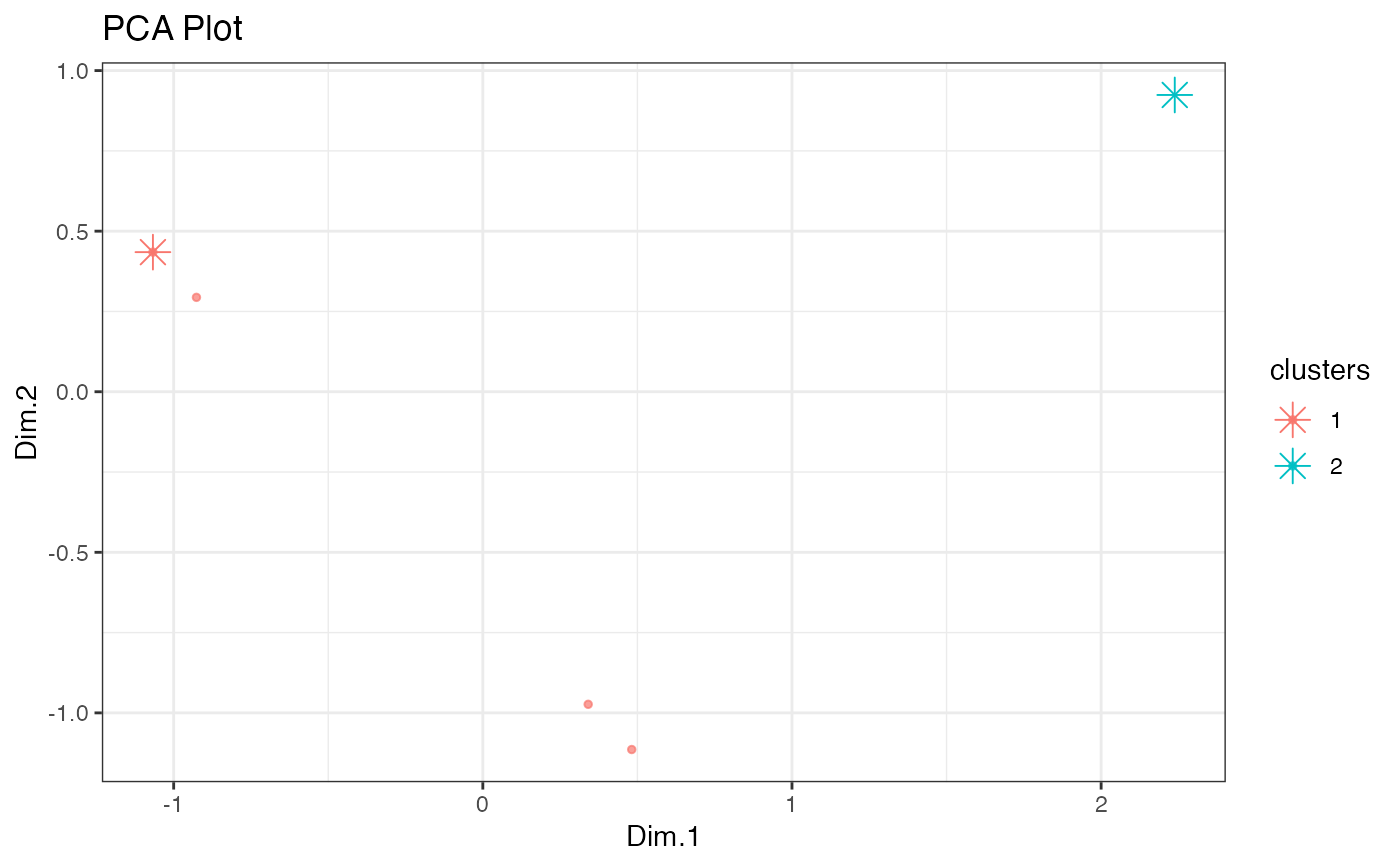
This function reduces a data set to 2 dimensions using principle component analysis (PCA) and colours clusters of points.
Source:R/show_clusters.R
show_clusters.RdThis function reduces a data set to 2 dimensions using principle component analysis (PCA) and colours clusters of points.
show_clusters(X, clusters, centroids)
Arguments
| X | array Data points of dimension (n,d) |
|---|---|
| clusters | array Cluster assignments for each point in X, dimension (n,1) |
| centroids | array Coordinates of cluster centers, dimension (k,d) |
Value
plot A 2d principal components scatter plot coloured by cluster
Examples
X = rbind(c(0,0), c(1,0), c(10,0), c(11,0))
centers = rbind(c(0, 0), c(10, 10))
labels <- c(1,1,1,1)
show_clusters(X, labels,centers)