Load kmeaningfulR library
library(kmeaningfulR)
#>
#> Attaching package: 'kmeaningfulR'
#> The following object is masked from 'package:base':
#>
#>     assign
Example array with 6 rows and 2 columns
X
#>      [,1] [,2]
#> [1,]    0    0
#> [2,]    1    1
#> [3,]   10   10
#> [4,]   10   11
#> [5,]   10    0
#> [6,]   10    1
Scale data
X_scaled <- preprocess(X)
X_scaled
#>              V1         V2
#> [1,] -1.0296477 -1.0296477
#> [2,] -0.8576632 -0.7990213
#> [3,]  0.6901973  1.2766166
#> [4,]  0.6901973  1.5072430
#> [5,]  0.6901973 -1.0296477
#> [6,]  0.6901973 -0.7990213
Find cluster centers and label of nearest center to every point
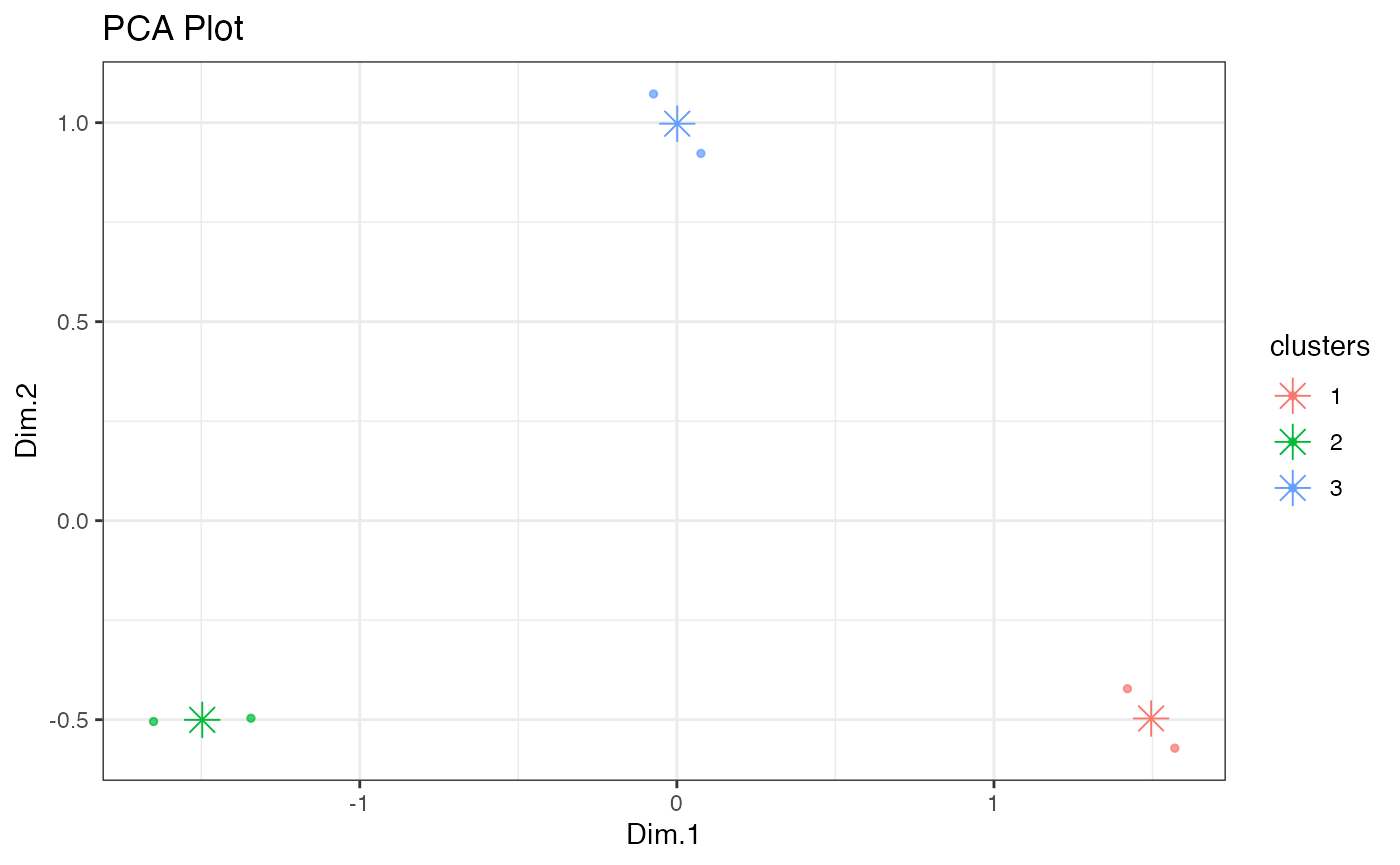
assign_list <- fit_assign(X_scaled, optimal_K)
centers <- assign_list[[1]]
labels <- assign_list[[2]]
assign_list
#> [[1]]
#>            [,1]       [,2]
#> [1,]  0.6901973  1.3919298
#> [2,] -0.9436555 -0.9143345
#> [3,]  0.6901973 -0.9143345
#>
#> [[2]]
#>      [,1]
#> [1,]    2
#> [2,]    2
#> [3,]    1
#> [4,]    1
#> [5,]    3
#> [6,]    3