Generates a correlation plot for the numeric variables in a dataframe, and prints the correlation values.
corrplot.RdGenerates a correlation plot for the numeric variables in a dataframe, and prints the correlation values.
corrplot(df, print_corr = FALSE, title = "Correlation Plot")Arguments
- df
The dataframe containing the data to be plotted.
- print_corr
Whether or not to print the correlation values between variables
- title
Title of the plot
Value
A ggplot object.
Examples
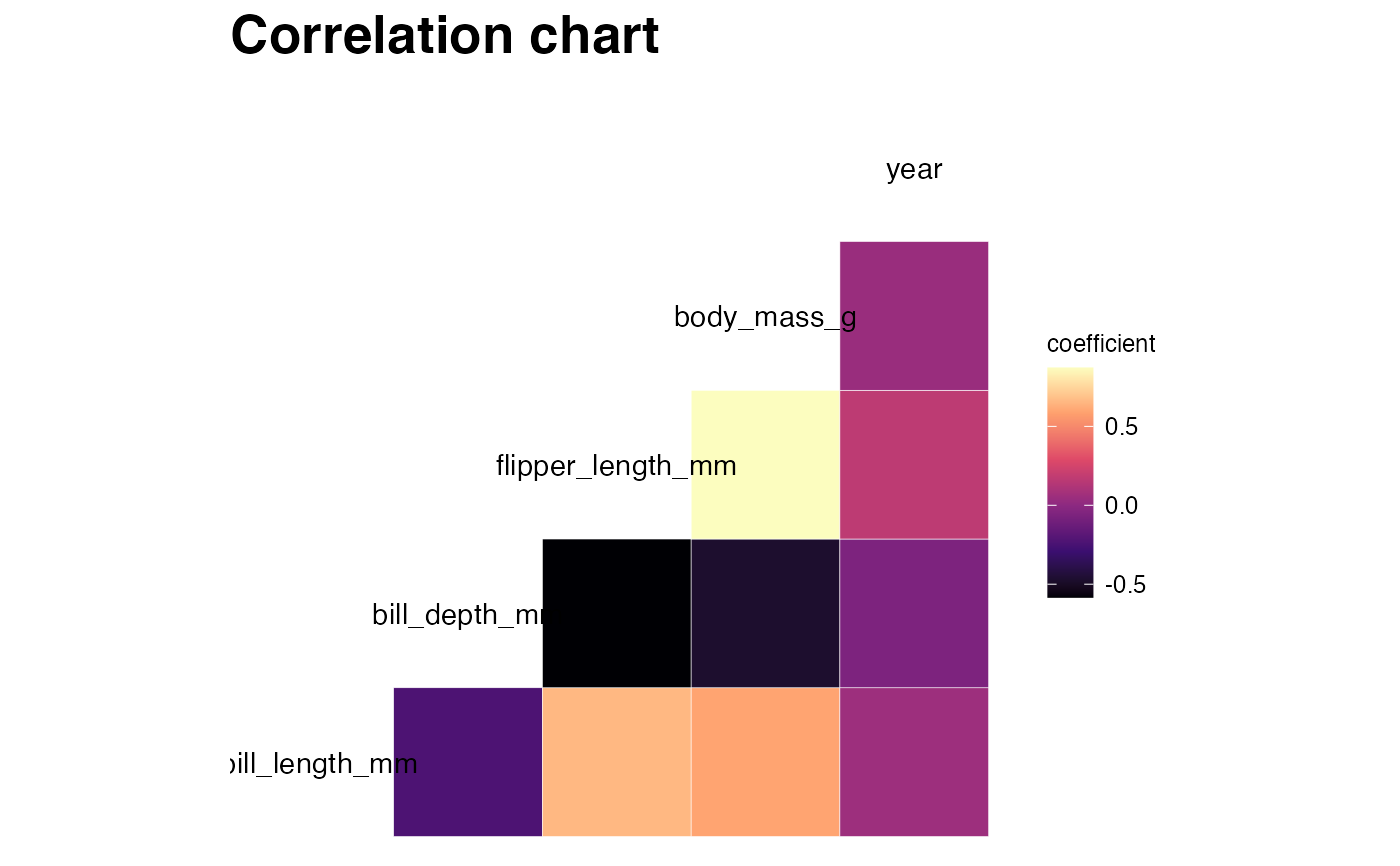
penguins_data <- palmerpenguins::penguins
corrplot(penguins_data, print_corr = FALSE, title = "Correlation chart")
#> Registered S3 method overwritten by 'GGally':
#>   method from
#>   +.gg   ggplot2
#> Warning: data in column(s) 'species', 'island', 'sex' are not numeric and were ignored
#> Scale for 'fill' is already present. Adding another scale for 'fill', which
#> will replace the existing scale.