magmavizR-vignette
magmavizR-vignette.RmdUsage
The magmavizR library can be loaded by using the commands below:
## # A tibble: 344 × 8
##    species island    bill_length_mm bill_depth_mm flipper_length_mm body_mass_g
##    <fct>   <fct>              <dbl>         <dbl>             <int>       <int>
##  1 Adelie  Torgersen           39.1          18.7               181        3750
##  2 Adelie  Torgersen           39.5          17.4               186        3800
##  3 Adelie  Torgersen           40.3          18                 195        3250
##  4 Adelie  Torgersen           NA            NA                  NA          NA
##  5 Adelie  Torgersen           36.7          19.3               193        3450
##  6 Adelie  Torgersen           39.3          20.6               190        3650
##  7 Adelie  Torgersen           38.9          17.8               181        3625
##  8 Adelie  Torgersen           39.2          19.6               195        4675
##  9 Adelie  Torgersen           34.1          18.1               193        3475
## 10 Adelie  Torgersen           42            20.2               190        4250
## # … with 334 more rows, and 2 more variables: sex <fct>, year <int>
The four data visualization functions included in the package along with the usage are outlined below:
Boxplot
Returns a boxplot based on the data frame, a numerical feature to view the distribution of and a categorical feature to bucket data into categories. Additionally, there is a boolean option to facet the boxplots into separate charts.
boxplot(penguins_data, species, bill_length_mm, facet = TRUE)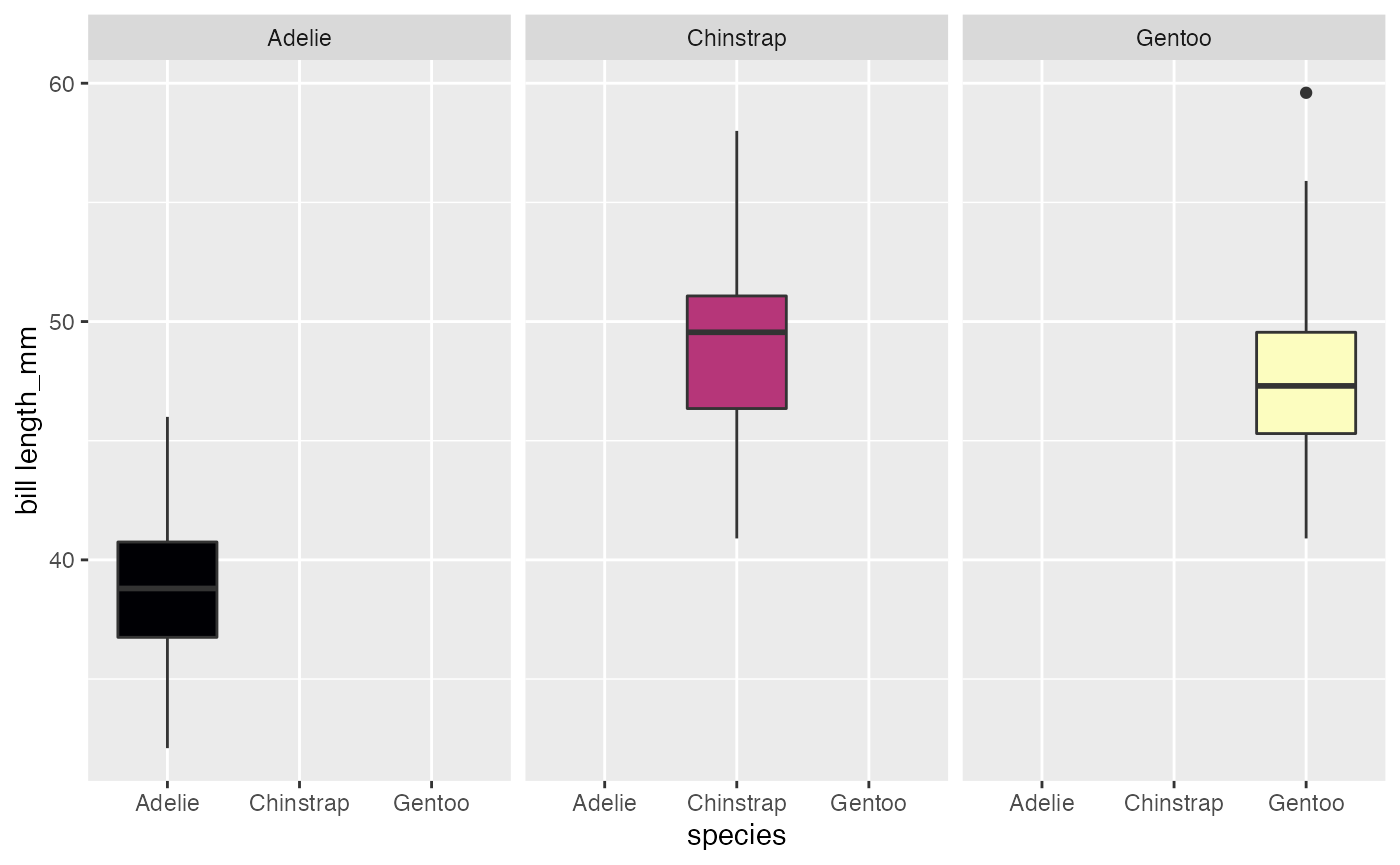
Correlation plot
Returns a correlation plot based on the numerical features present in the data frame. Additionally, it will print the correlated numerical feature pairs along with their correlation values.
corrplot(penguins_data, print_corr = TRUE, title = "Correlation")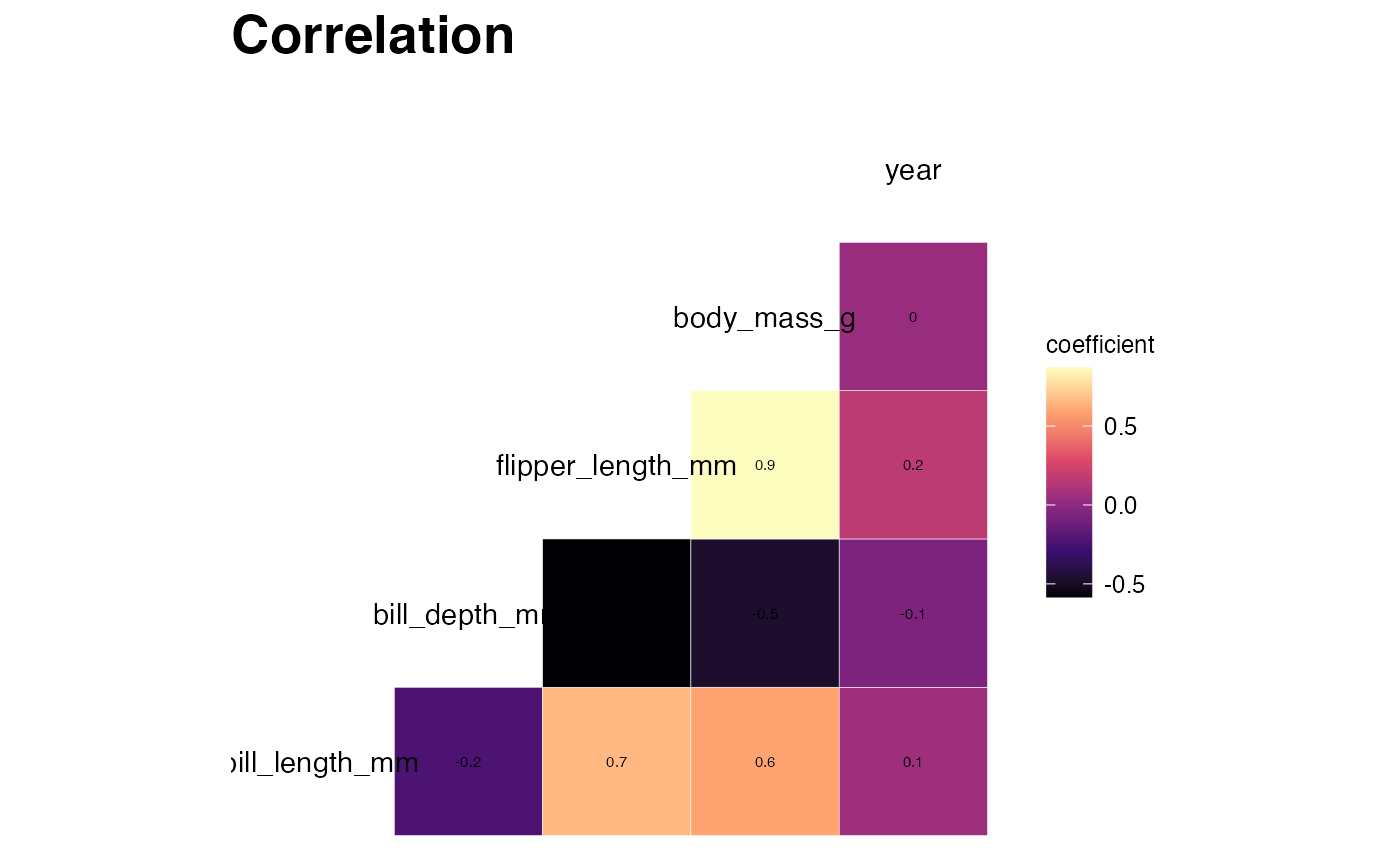
Histogram
Returns a histogram based on the data frame and a numeric feature to plot on the x-axis. The y-axis will display the result of the following aggregating functions:
count
ncount
density
ndensity
width
histogram(penguins_data, bill_length_mm, "..count..")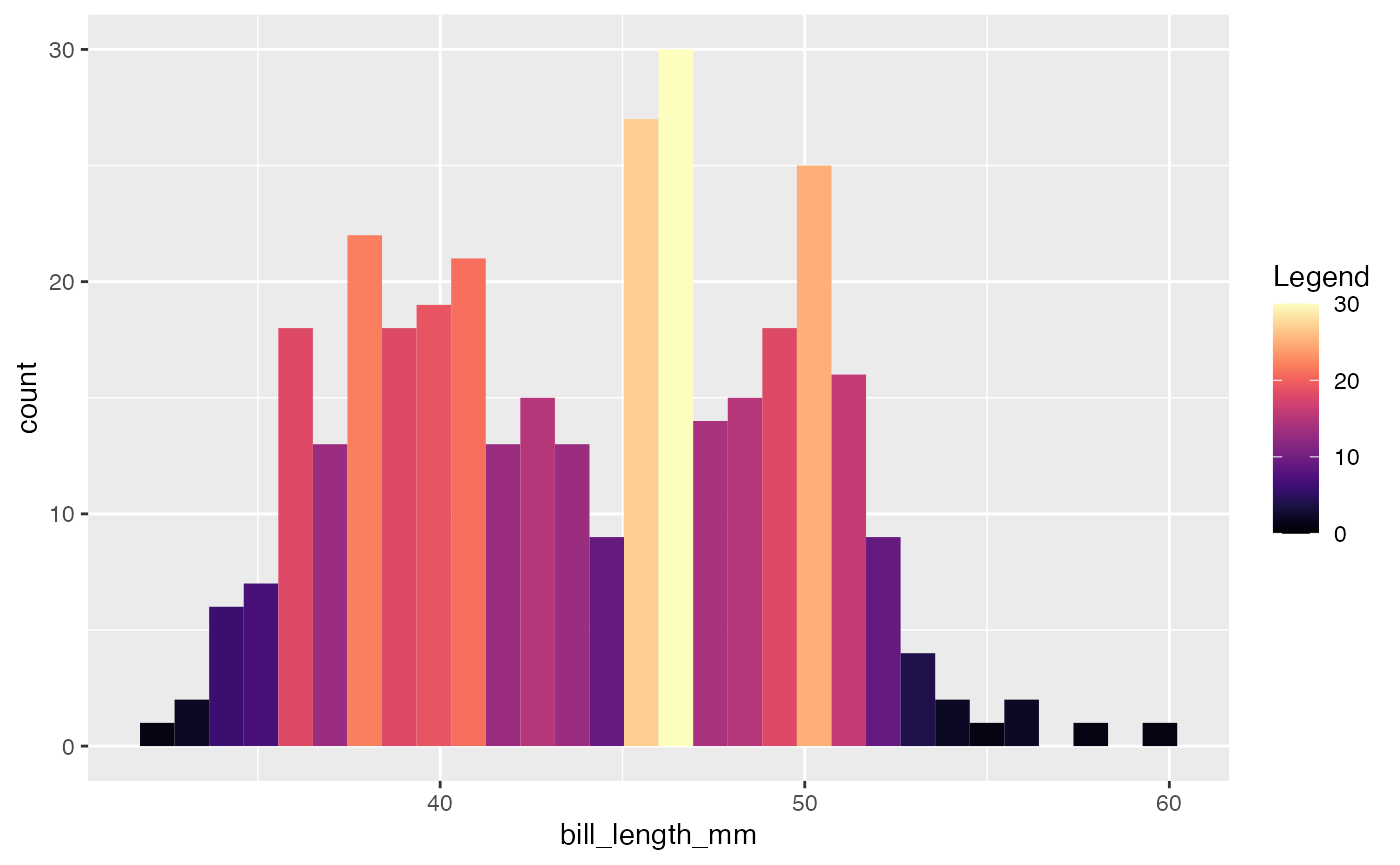
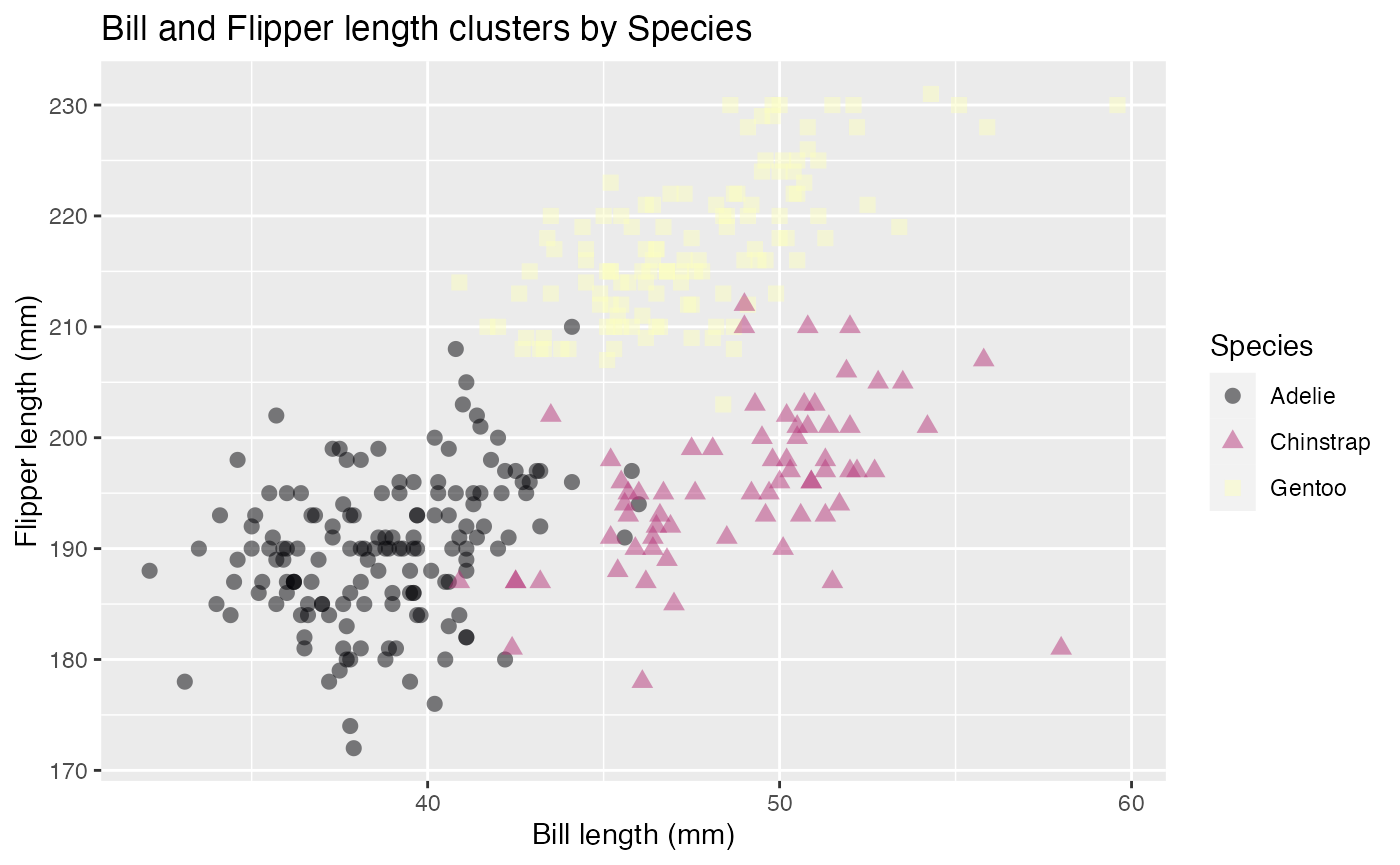
Scatterplot
Returns a scatterplot based on the data frame and two numerical feature names passed as the required inputs. There are auxiliary inputs that provide the flexibility to:
Color code or change the shape of the data points on a categorical variable
Set a title to the plot, x-axis, y-axis and color legend
Change the opacity and size of the data points
Set the scale of the x-axis and y-axis to start from zero
scatterplot(penguins_data, bill_length_mm, flipper_length_mm, species, "Bill and Flipper length clusters by Species", 0.5, 2.5, "Bill length (mm)", "Flipper length (mm)", "", FALSE, FALSE, TRUE)