Create a histogram with the magma color scheme
histogram.RdCreate a histogram with the magma color scheme
histogram(df, x, y)Arguments
- df
A dataframe containing the variables for plotting
- x
Column name of the numeric variable to be plotted on the x-axis
- y
The quoted aggregation function to be plotted on the y-axis and to be used for the fill color. The input needs to be in the form of ..name.., where name can be values from the following list, with explanations in the parenthesis: count (number of points in bin), density (density of points in bin, scaled to integrate to 1), ncount (count, scaled to maximum of 1), ndensity (density, scaled to maximum of 1), width (widths of bins)
Value
A ggplot object.
Examples
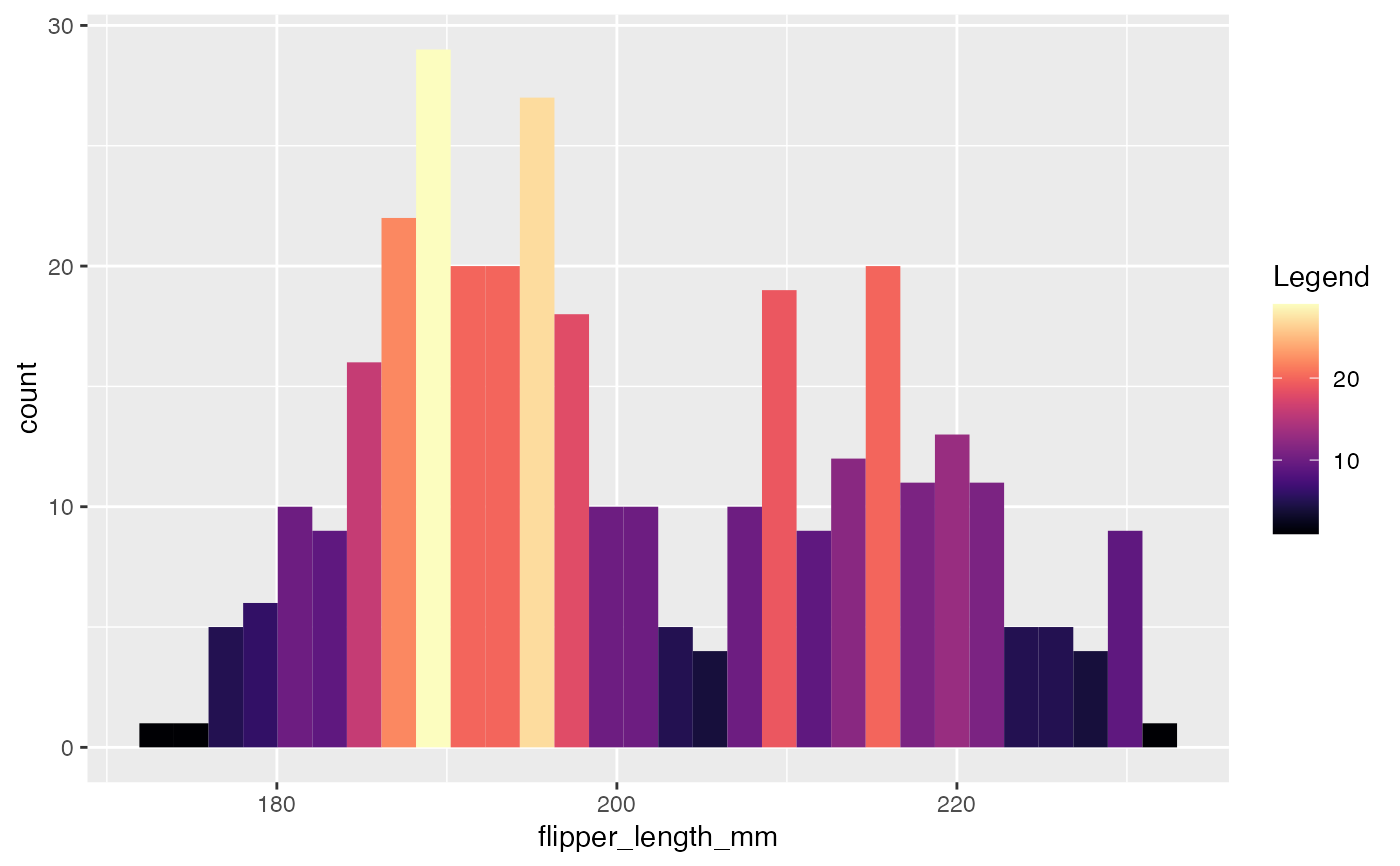
library(palmerpenguins)
penguins_data <- penguins
histogram(penguins, flipper_length_mm, "..count..")
#> `stat_bin()` using `bins = 30`. Pick better value with `binwidth`.
#> Warning: Removed 2 rows containing non-finite values (stat_bin).