Create a scatterplot using the magma color scheme
scatterplot.RdCreate a scatterplot using the magma color scheme
scatterplot(
  df,
  x,
  y,
  c = NULL,
  t = "",
  o = 0.5,
  s = 3,
  xtitle = "",
  ytitle = "",
  ctitle = "",
  xzero = FALSE,
  yzero = FALSE,
  shapes = FALSE
)
Arguments
- df
A dataframe to use for the scatterplot.
- x
Column-name of the numerical or categorical variable to be plotted on the x-axis
- y
Column-name of the numerical or categorical variable to be plotted on the y-axis
- c
Column-name of the categorical variable to color-code the data points Default value is blank for cases when there is no categorical column
- t
Title of the plot. Default value is blank. If not provided, title will be computed based on x, y and/or c
- o
Opacity of the data points. Number between 0.1 and 1.0 (inclusive)
- s
Size of the data points. Number between 1 and 5 (inclusive)
- xtitle
Title of the x-axis. Default value is blank. If not provided, title will be proper case of the x axis column
- ytitle
Title of the x-axis. Default value is blank. If not provided, title will be proper case of the y axis column
- ctitle
Title of the x-axis. Default value is blank. If not provided, title will be proper case of the color column
- xzero
Scale the x-axis to start from 0 by specifying TRUE Default value is set to FALSE
- yzero
Scale the x-axis to start from 0 by specifying TRUE Default value is set to FALSE
- shapes
Assign the color column to the shape attribute of the plot if TRUE Default value is set to FALSE
Value
A ggplot object.
Examples
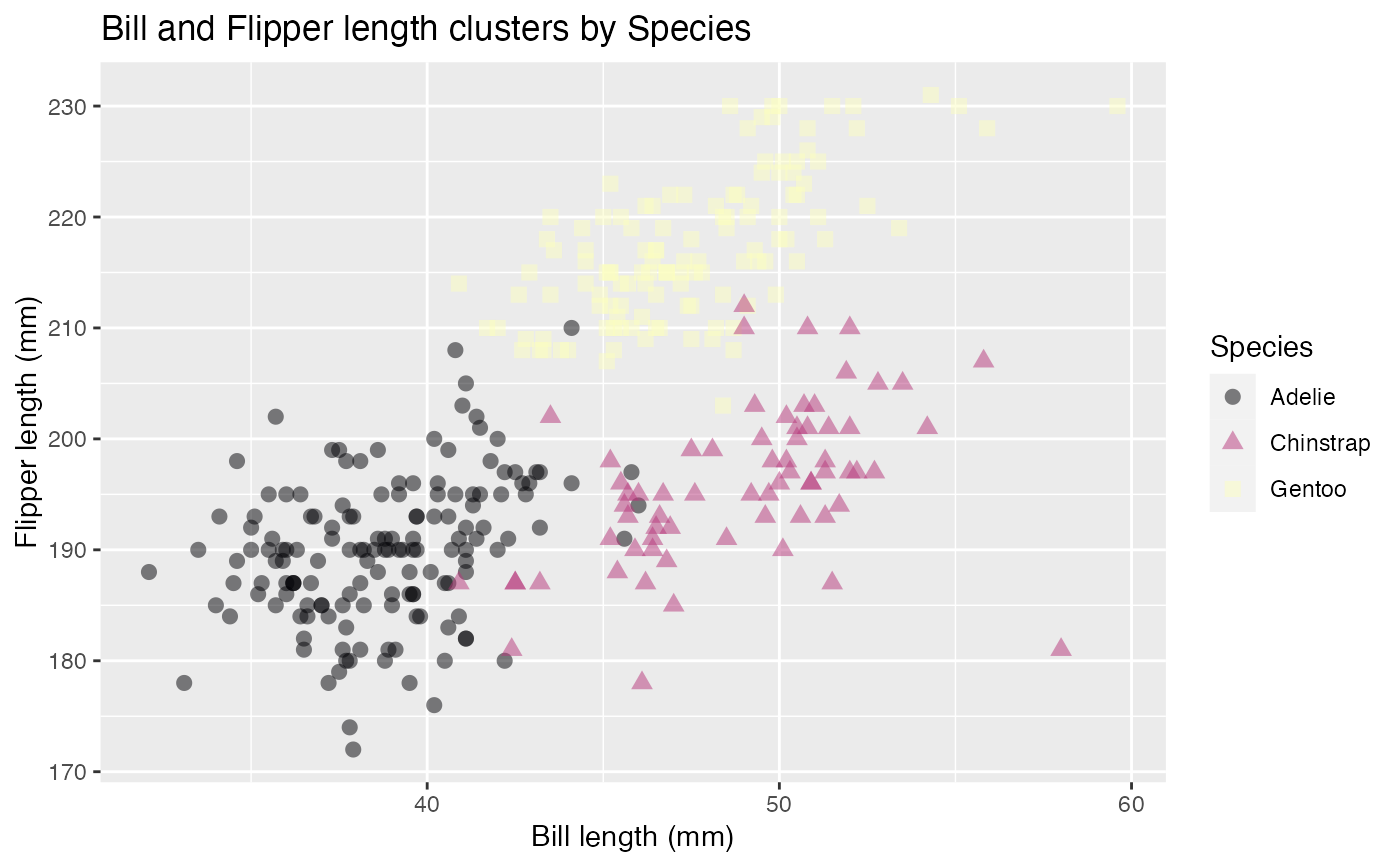
penguins_data <- palmerpenguins::penguins
scatterplot(penguins_data, bill_length_mm, flipper_length_mm, species,
              "Bill and Flipper length clusters by Species",
              0.5, 2.5, "Bill length (mm)", "Flipper length (mm)", "", FALSE, FALSE, TRUE)
#> Warning: Removed 2 rows containing missing values (geom_point).